Reports
Reports are a tool for generating and viewing data summaries and insights within the application. They allow users to create custom reports based on various data sources and criteria.
How to access to the Reports module?
Section titled “How to access to the Reports module?”To access the Reports module, you can use the global navigation or the settings panel. First, go to the settings page by clicking on the profile top right corner and selecting “Settings”.
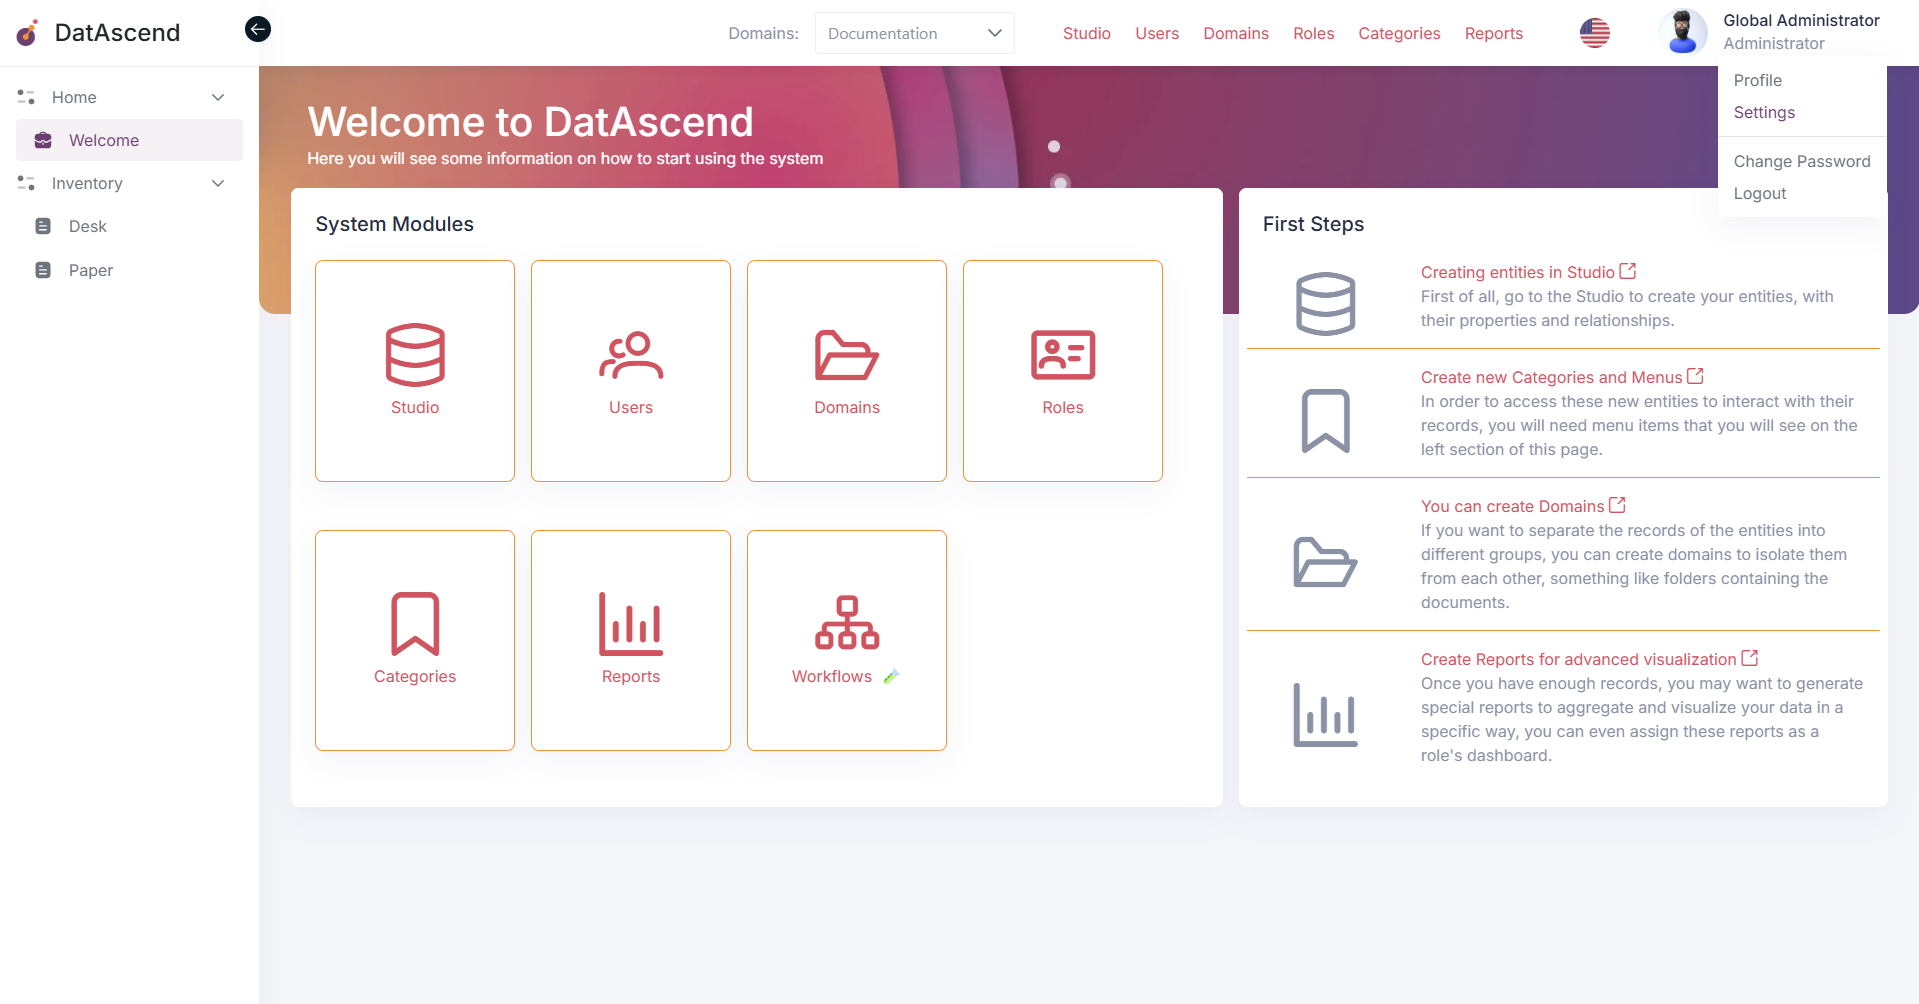
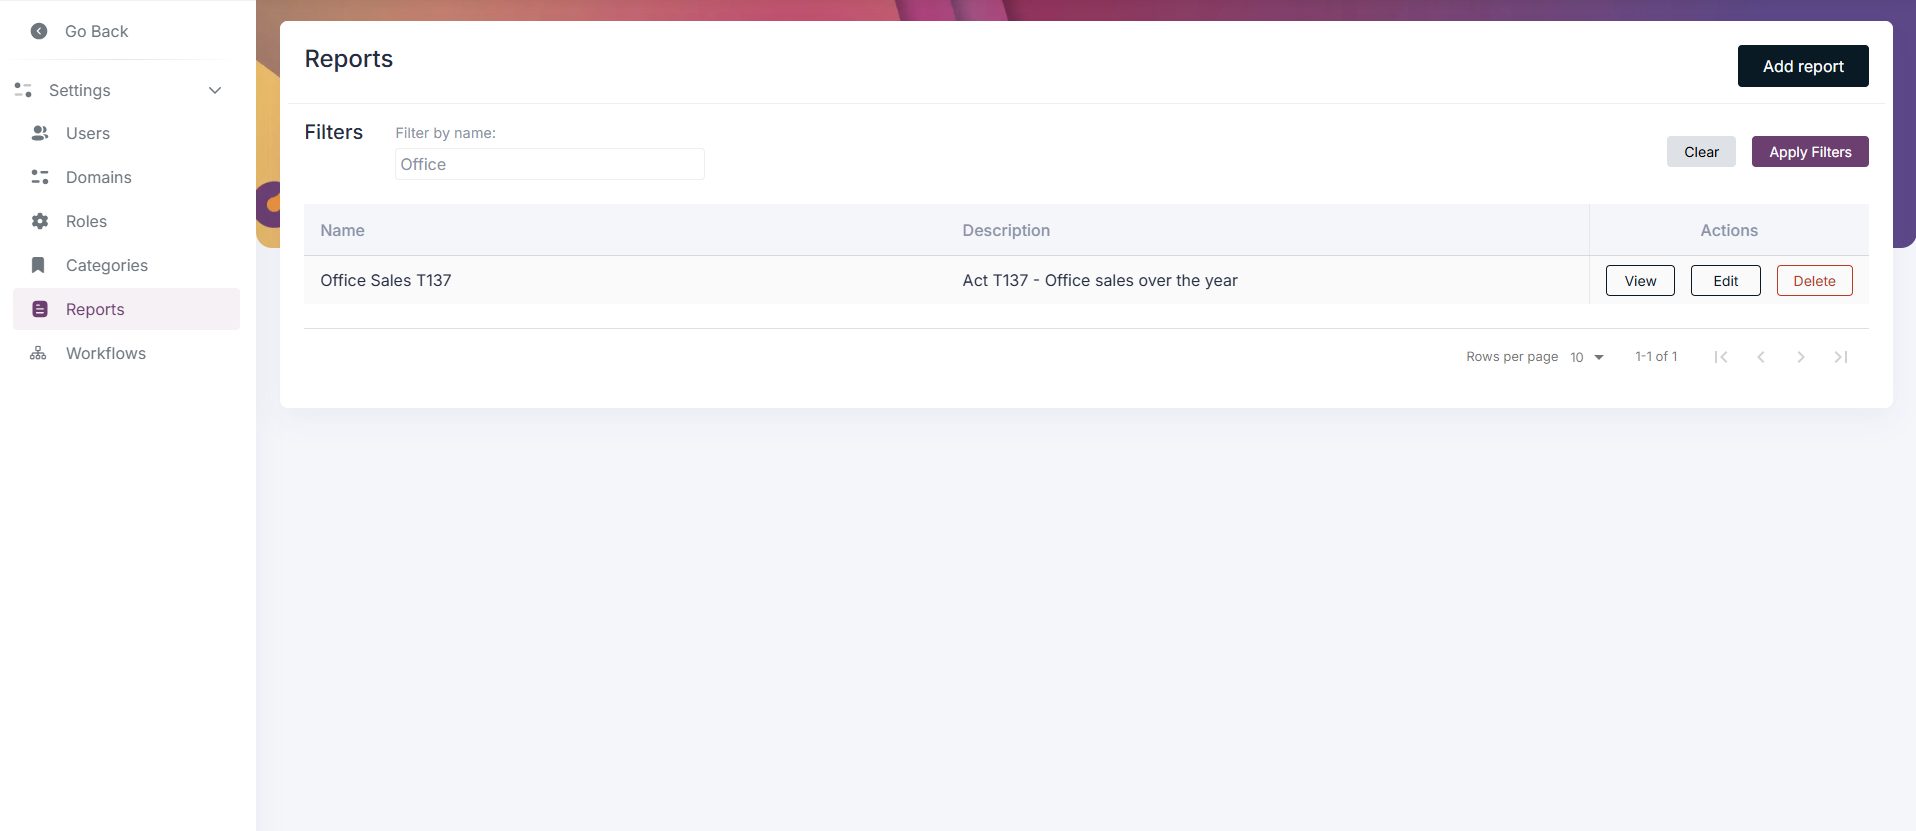
Then, in the settings panel, you will find the “Reports” option in the sidebar.
-
Using the filter input at the top can help you to find the report that you are looking for.
How to create a new Report?
Section titled “How to create a new Report?”To create a new Report, click on the “Add Report” button located at the top right corner of the page. The next screen will display a form where you can enter the details of the new report, such as name, description, and filter criteria. Each of the fields for filter criteria can be configured to refine the data that will be included in the report.
First, is possible to create a variable that will be used in the report.
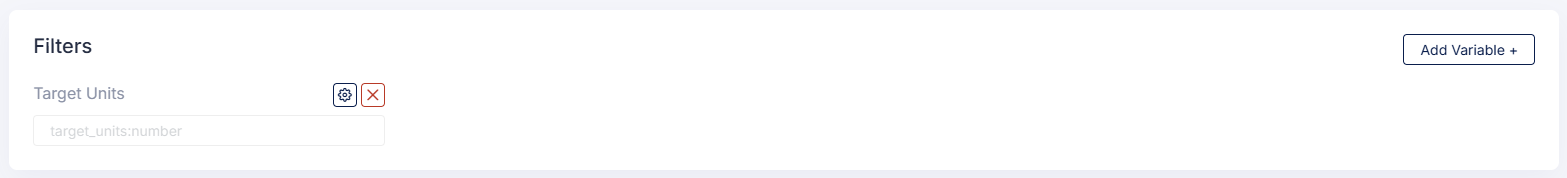
For example, you can create a variable for the date range or specific user segments. Start by clicking on the “Add Variable” button. Next, fill in the variable name, label and type.
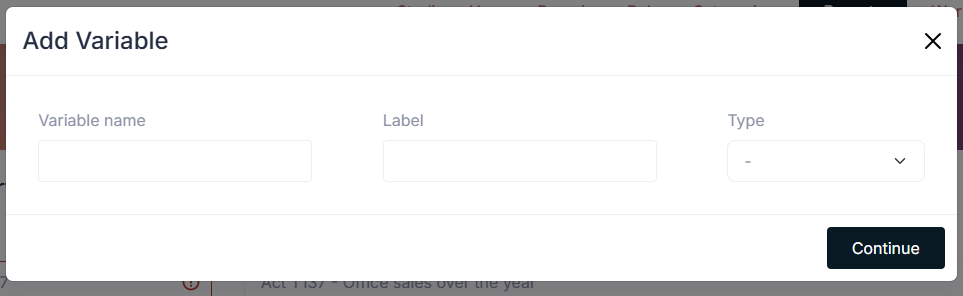
The types available for the variable creation are:
- Date and Time
- Boolean
- String
- Number
- Date
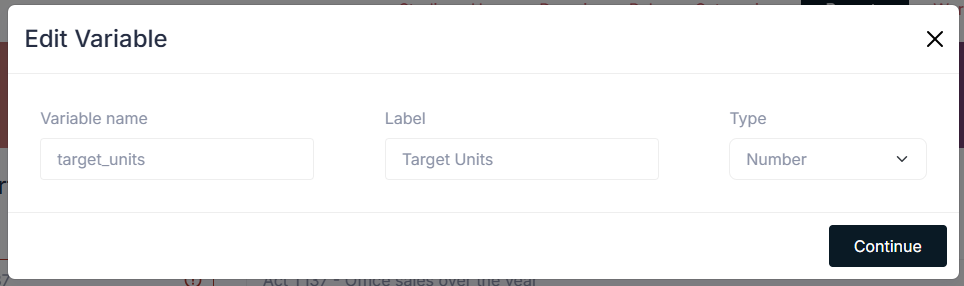
After filling in the form, click on the “Continue” button to proceed, the variable now will be listed in the variables section. Also, is possible to edit or delete a variable by clicking on the respective icons next to each variable in the list.
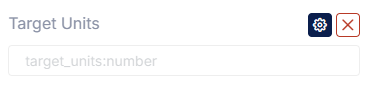
When the variable is edited a modal will appear with the variable details, you can modify the name, label and type of the variable.
Next, the report can be configured by adding the necessary sections to be included in the report. To add a section, click on the “Add Section” button.
You can choose from different types of sections, as the following:
- Table: this section will display the data in a tabular format.
- Pie Chart: this section will display a pie chart to visualize the data distribution from a specific field.
- Bar Chart: this section will display a bar chart to visualize the data trends over time or across categories.
- Counter: this section will display a single value, such as a total count or sum over a field.
The configuration options for each section will vary depending on the type of section selected. This guide will demonstrate how to configure each type of section.
Counter Section
Section titled “Counter Section”-
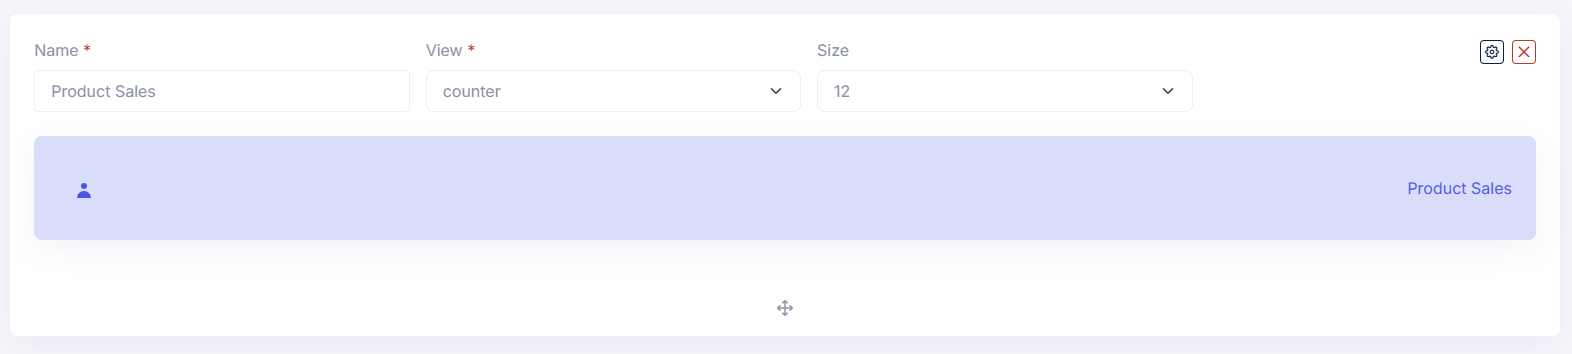
Create a new section.
-
Select the “Counter” as view type.
-
Fill in the section name and size (from 1 to 12).
-
Use the gear icon to open the configuration modal on top right corner of the section.
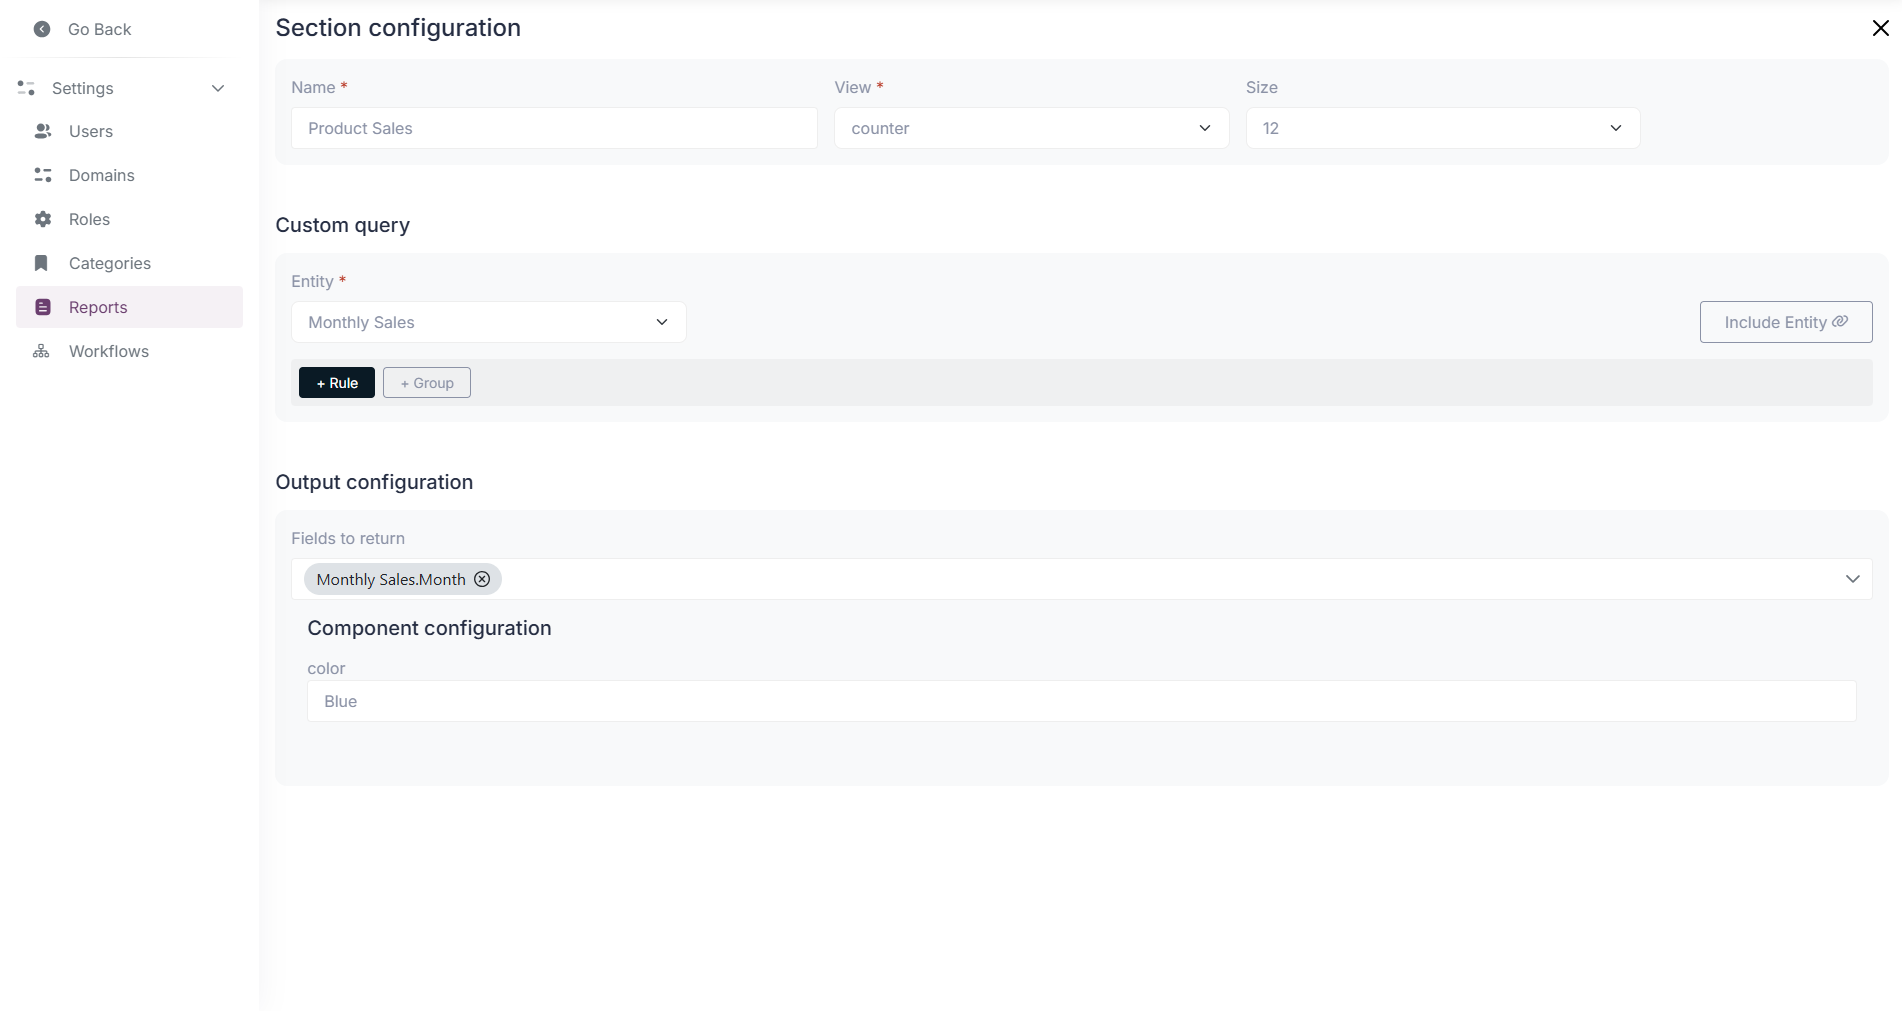
-
In the configuration modal, select the data source for the counter, this will be the entity from which the data will be fetched.
- Optionally, you can apply filters to the data by clicking on the ”+ Rule” button and selecting the desired criteria.
- Optionally, you can use variables created before in the rules for the counter display.
-
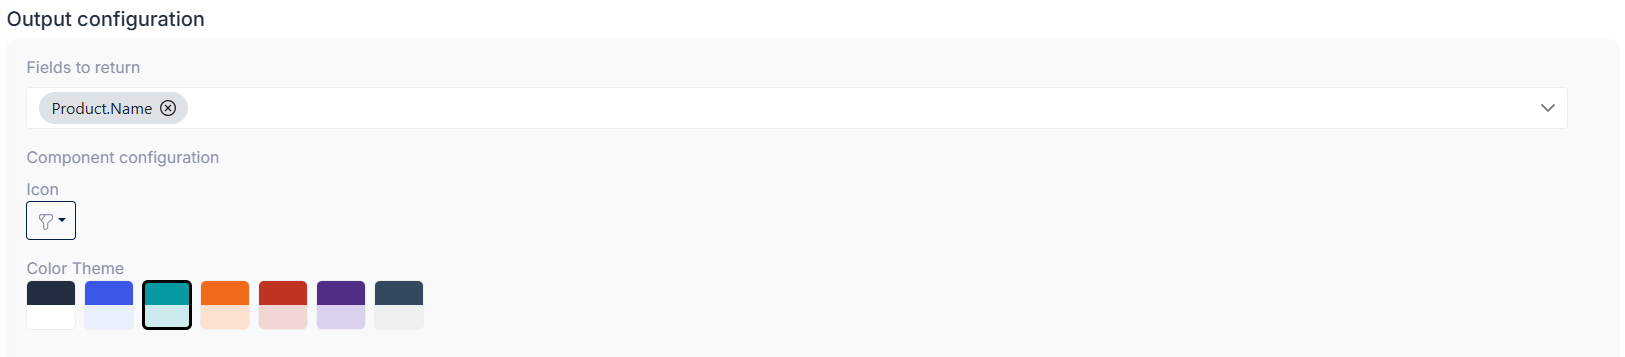
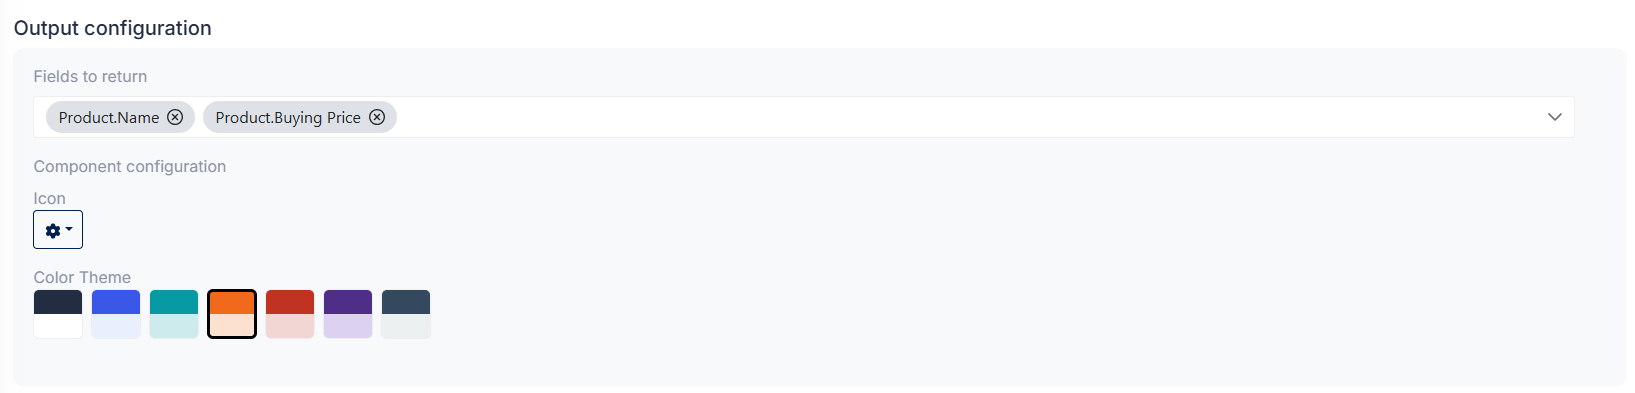
Next, select the fields to be returned by the section and the color for the counter display.
-
Click on the close icon top right corner to save the configuration.
-
Remember to save the report by clicking on the “Save” button located at the bottom right of the page.
Pie Chart Section
Section titled “Pie Chart Section”-
Create a new section.
-
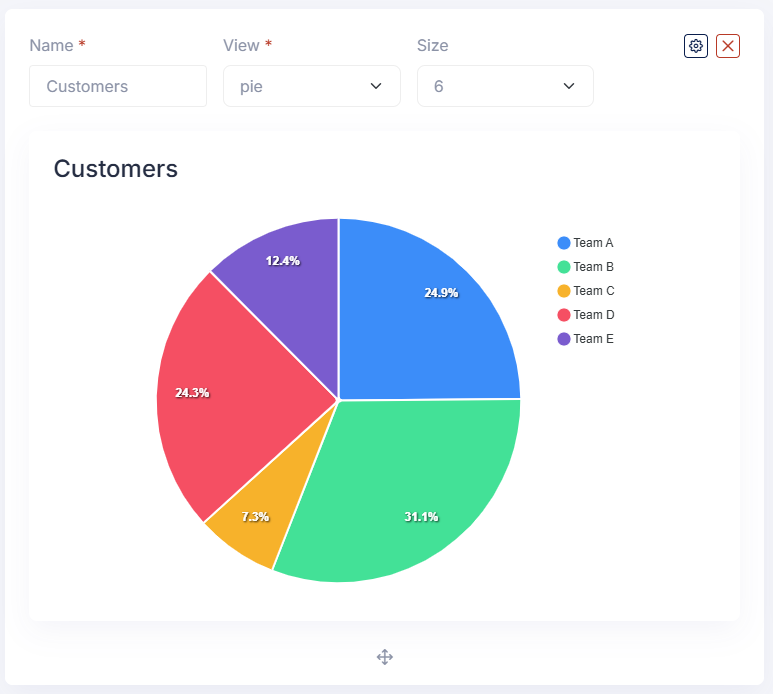
Select the “Pie Chart” as view type.
-
Fill in the section name and size (from 1 to 12).
-
Use the gear icon to open the configuration modal on top right corner of the section.
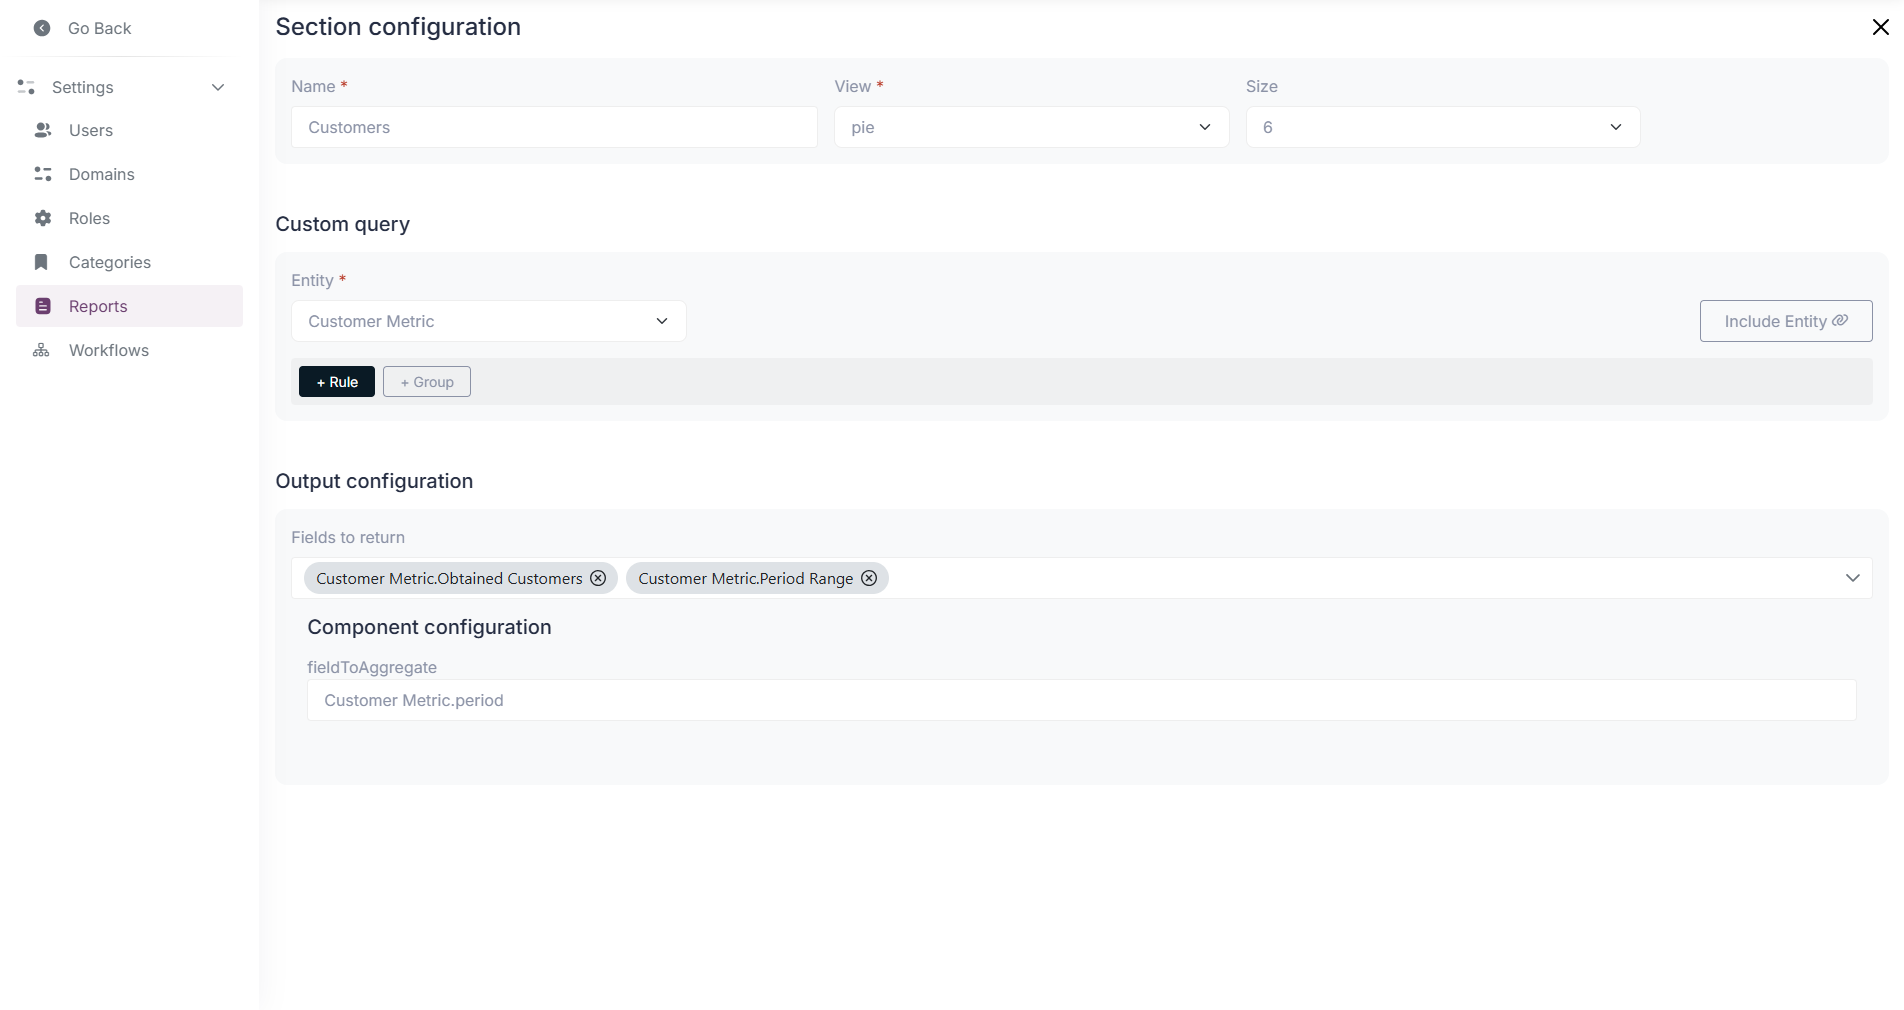
-
In the configuration modal, select the data source for the pie chart, this will be the entity from which the data will be fetched.
- Optionally, you can apply filters to the data by clicking on the ”+ Rule” button and selecting the desired criteria.
- Optionally, you can use variables created before in the rules for the pie chart display
-
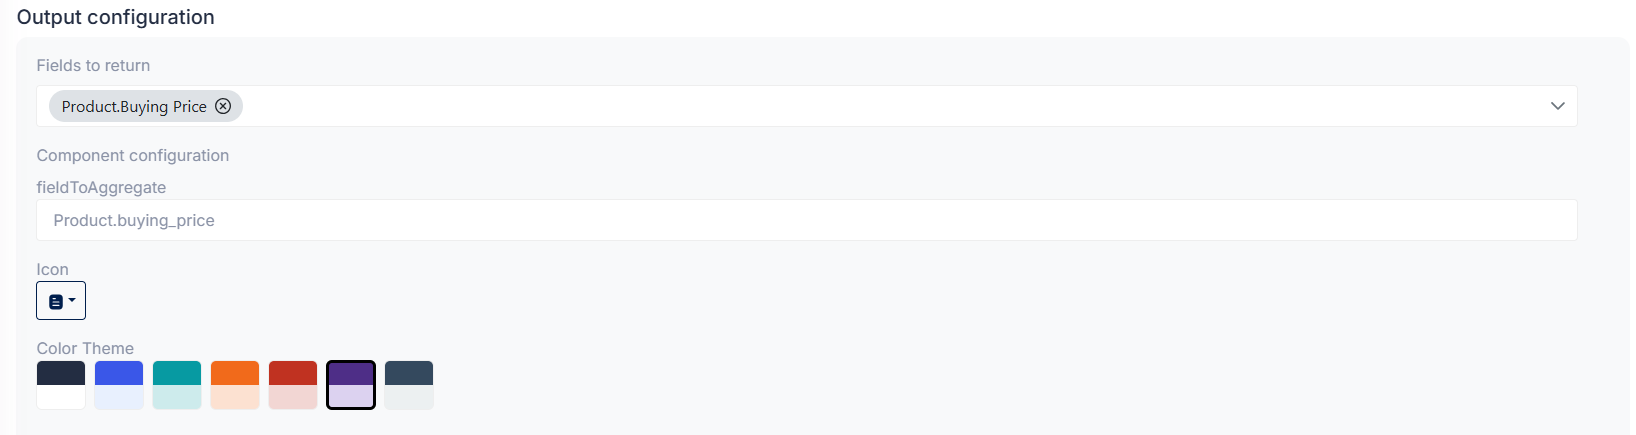
Next, select the field to be returned by the section and the aggregation field which will determine the size of each slice in the pie chart.
-
Click on the close icon top right corner to save the configuration.
-
Remember to save the report by clicking on the “Save” button located at the bottom right of the page.
Bar Chart Section
Section titled “Bar Chart Section”-
Create a new section.
-
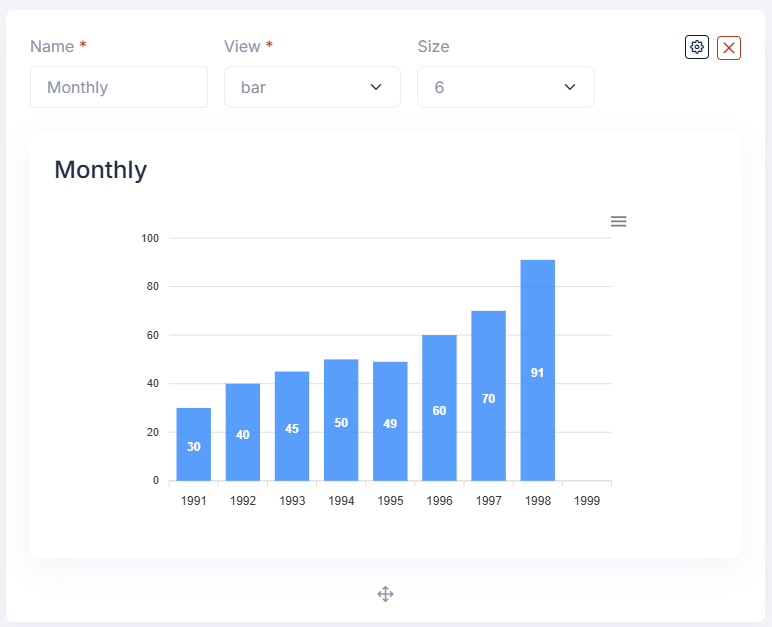
Select the “Bar Chart” as view type.
-
Fill in the section name and size (from 1 to 12).
-
Use the gear icon to open the configuration modal on top right corner of the section.

-
In the configuration modal, select the data source for the bar chart, this will be the entity from which the data will be fetched.
- Optionally, you can apply filters to the data by clicking on the ”+ Rule” button and selecting the desired criteria.
- Optionally, you can use variables created before in the rules for the bar chart display.
-
Next, select the fields to be returned by the section and the aggregation field which will determine the height of each bar in the chart.
-
Click on the close icon top right corner to save the configuration.
-
Remember to save the report by clicking on the “Save” button located at the bottom right of the page.
Table Section
Section titled “Table Section”-
Create a new section.
-
Select the “Table” as view type.
-
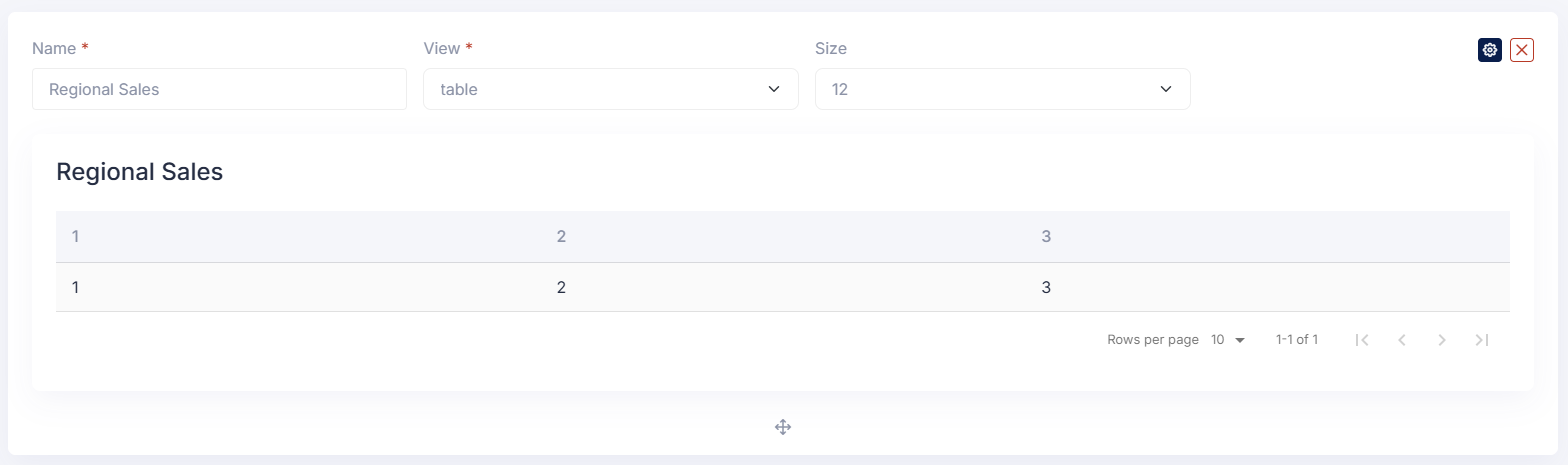
Fill in the section name and size (from 1 to 12).
-
Use the gear icon to open the configuration modal on top right corner of the section.
-
In the configuration modal, select the data source for the table, this will be the entity from which the data will be fetched.
- Optionally, you can apply filters to the data by clicking on the ”+ Rule” button and selecting the desired criteria.
- Optionally, you can use variables created before in the rules for the table display.
-
Next, select the fields to be displayed in the table with the dropdown menu on the bottom of the modal.
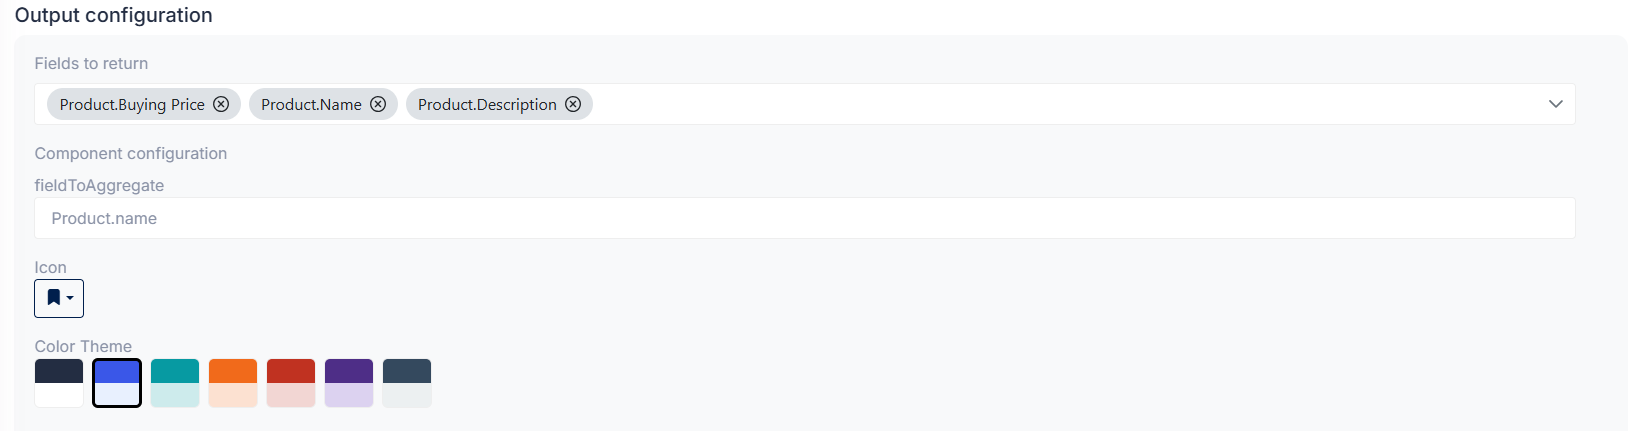
-
Click on the close icon top right corner to save the configuration.
-
Remember to save the report by clicking on the “Save” button located at the bottom right of the page.
How to use the Report Custom Query Builder?
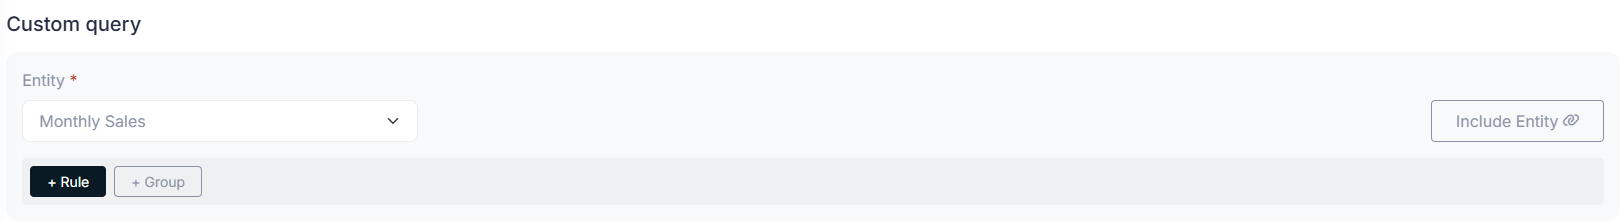
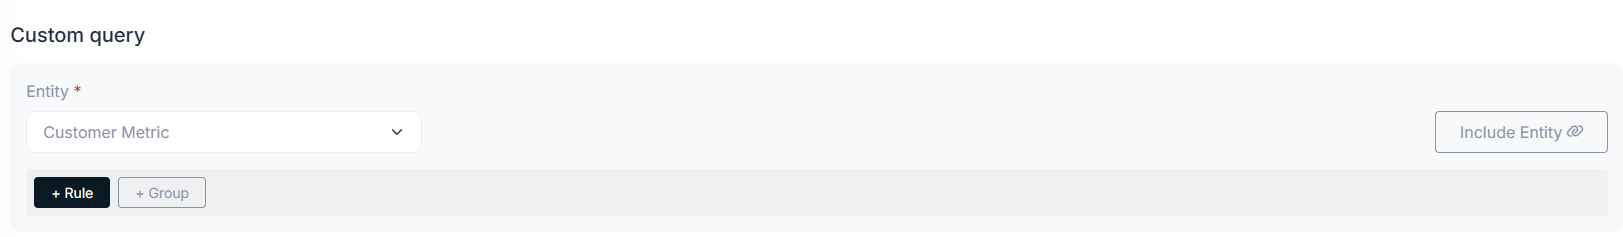
Section titled “How to use the Report Custom Query Builder?”This builder allows you to create complex queries to filter and aggregate data for your reports. To access use the configuration button (gear icon) on the top right corner of each section. On the Custom Query section of the configuration, allows you to write custom queries using a simple and intuitive interface.
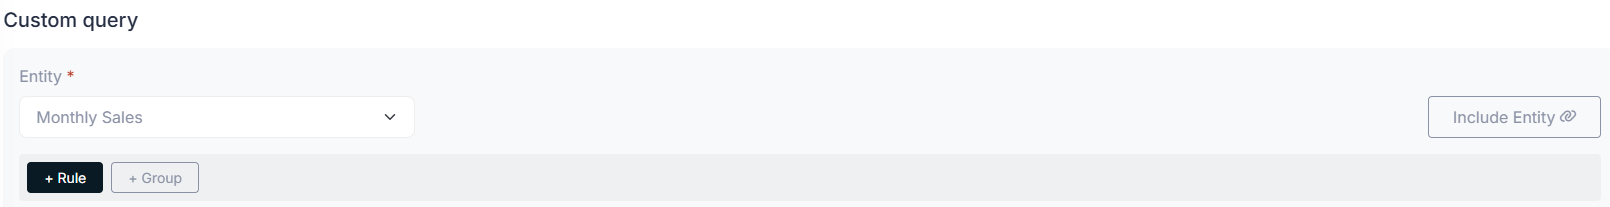
- Select a main data source for the query, it needs to be an entity available in the application.
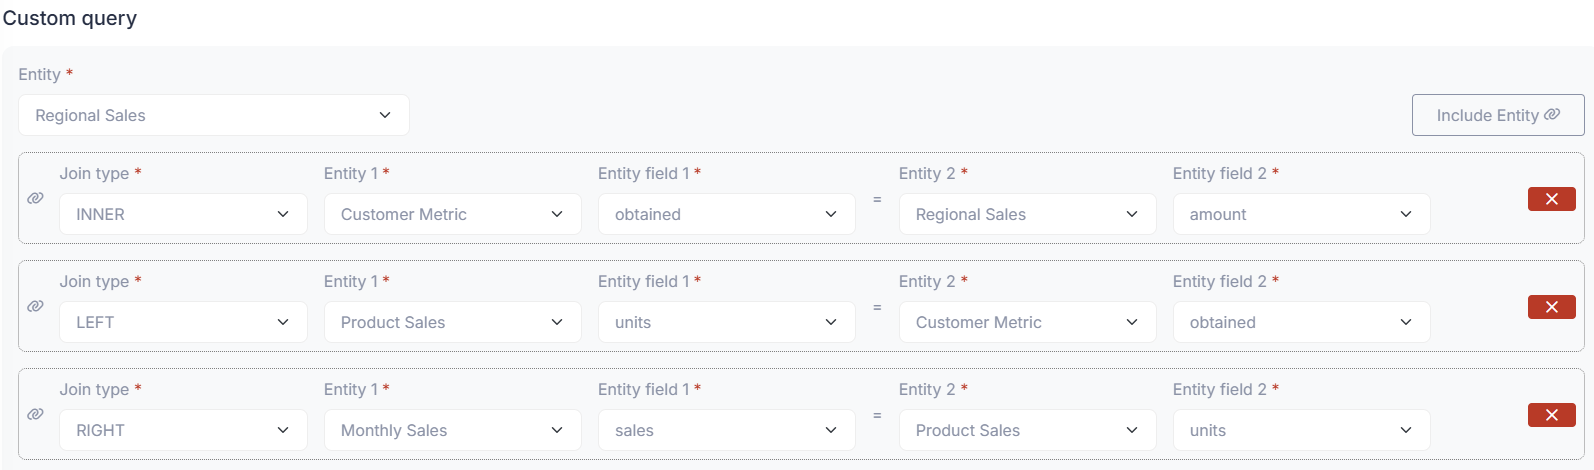
- Using multiple data sources is supported by using the “Include entity” option, which allows you to join related entities to the main data source.
- The “Include entity” option will create a basic join structure from the dropdowns available, please fill them according to your needs as follows:
- Type of join: Inner, Left, Right
- First entity: Main entity selected for the query
- First field: Field from the main entity to be used in the join
- Second entity: Related entity to be joined by the query
- Second field: Field from the related entity to be used in the join
- Example of a join between two entities:
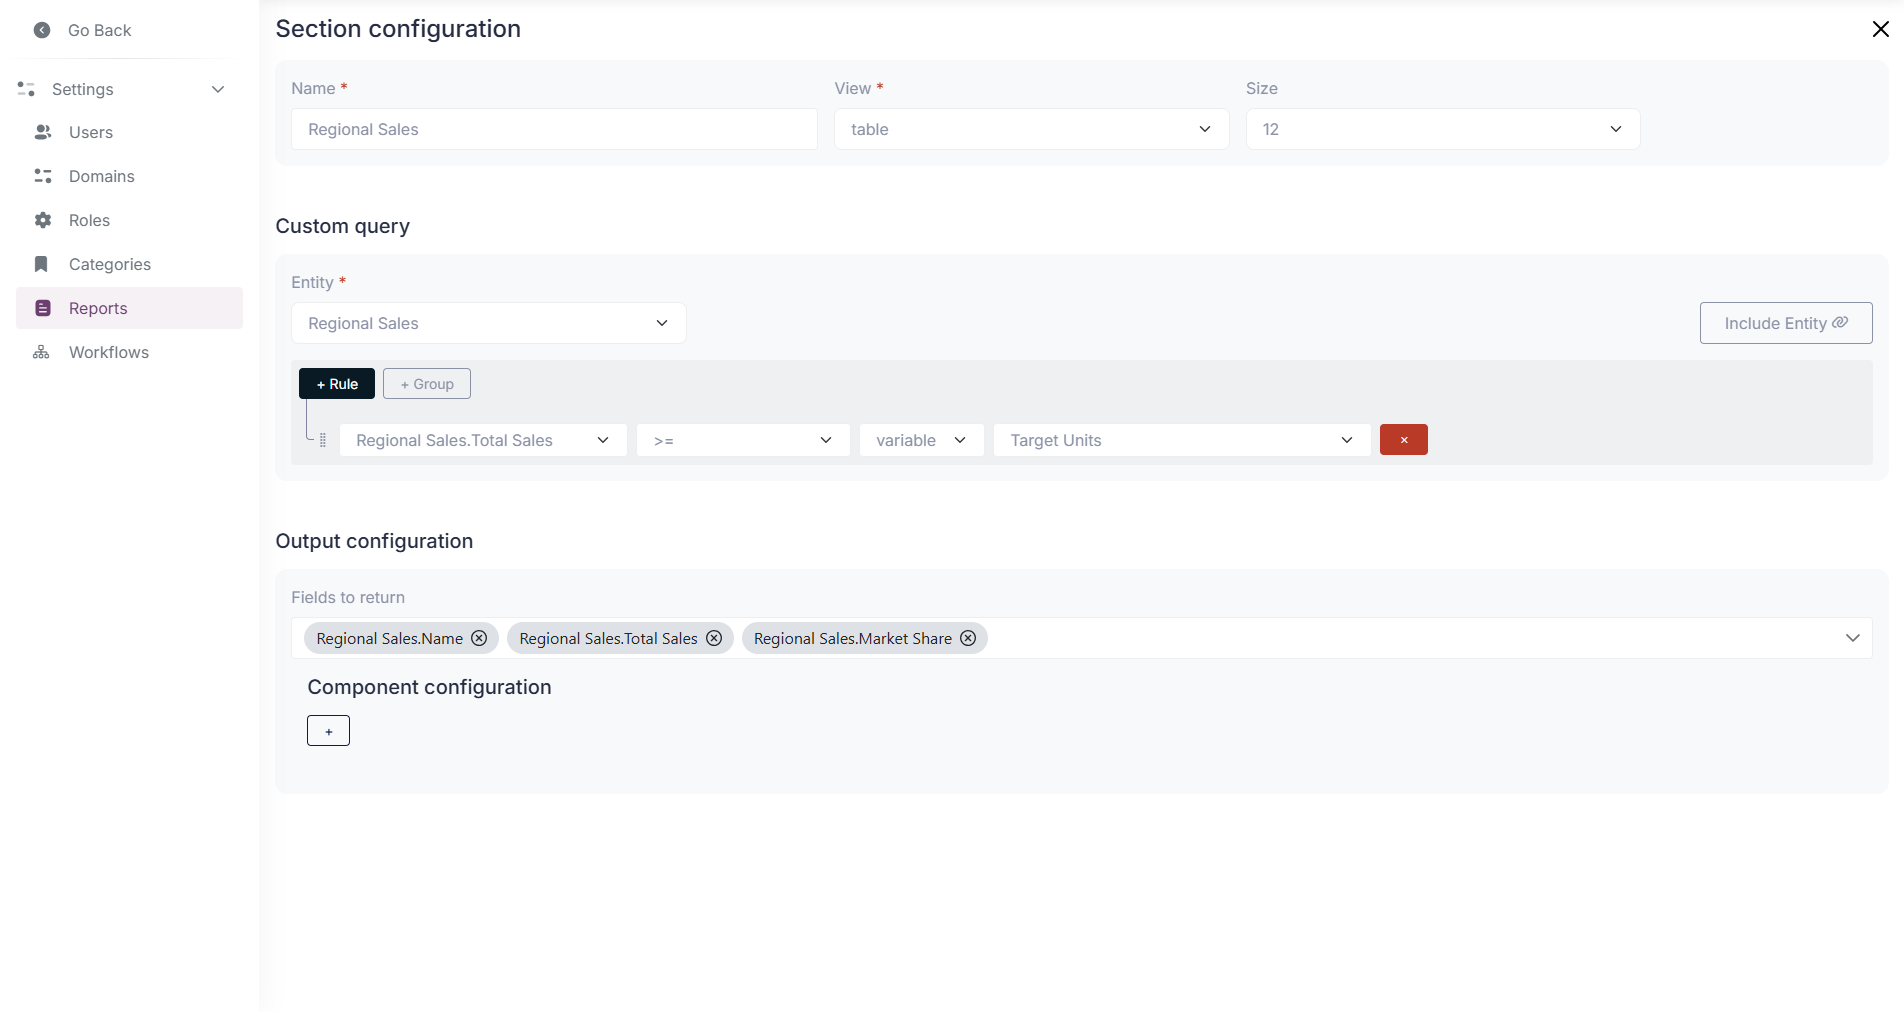
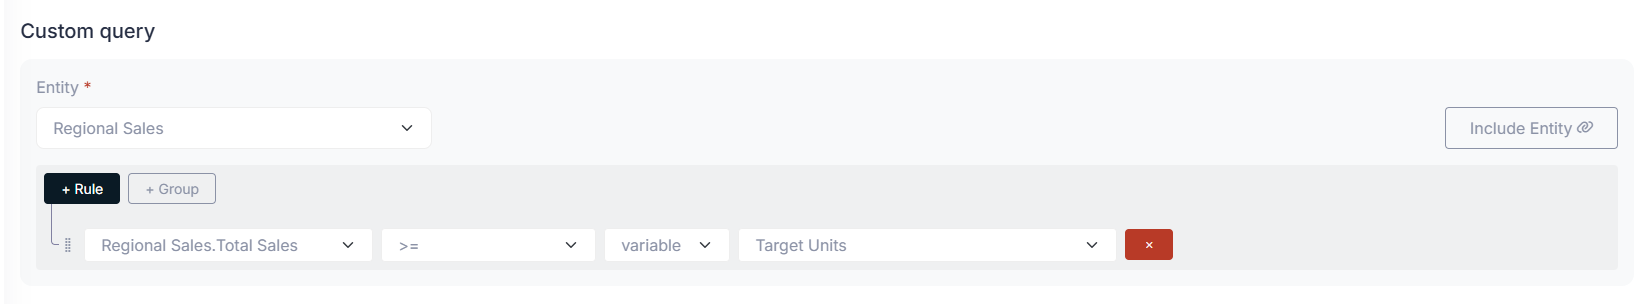
- Add rules to filter the data by clicking on the ”+ Rule” button and selecting the desired criteria.
- You can use variables created before in the rules for the section display.
- Example of a rule using a variable:

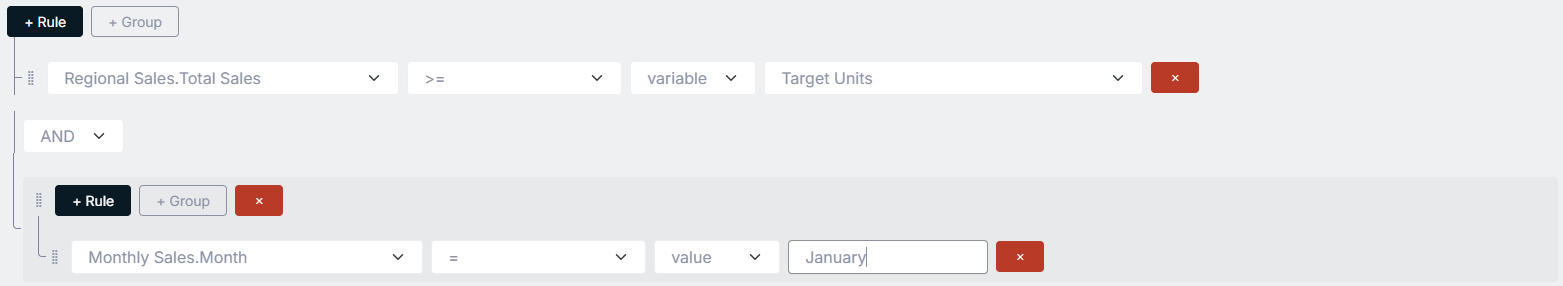
- Grouping of rules is supported by using the ”+ Group” button, which allows you to create nested conditions for the query using AND/OR operators.
- Example of a group of rules:
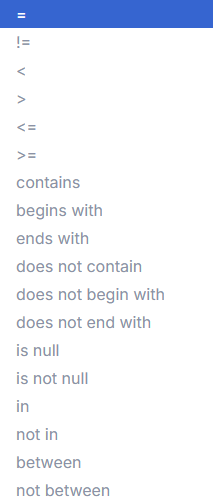
There are some available operators for the rules as seen in the following image:
- The default operator is “equals”, but you can change it by clicking on the operator dropdown.
How to view a Report in the module?
Section titled “How to view a Report in the module?”To view a report, go to the Reports module and click on the “View” button next to the desired report.
-
Using the filter input at the top can help you to find the report that you are looking for.
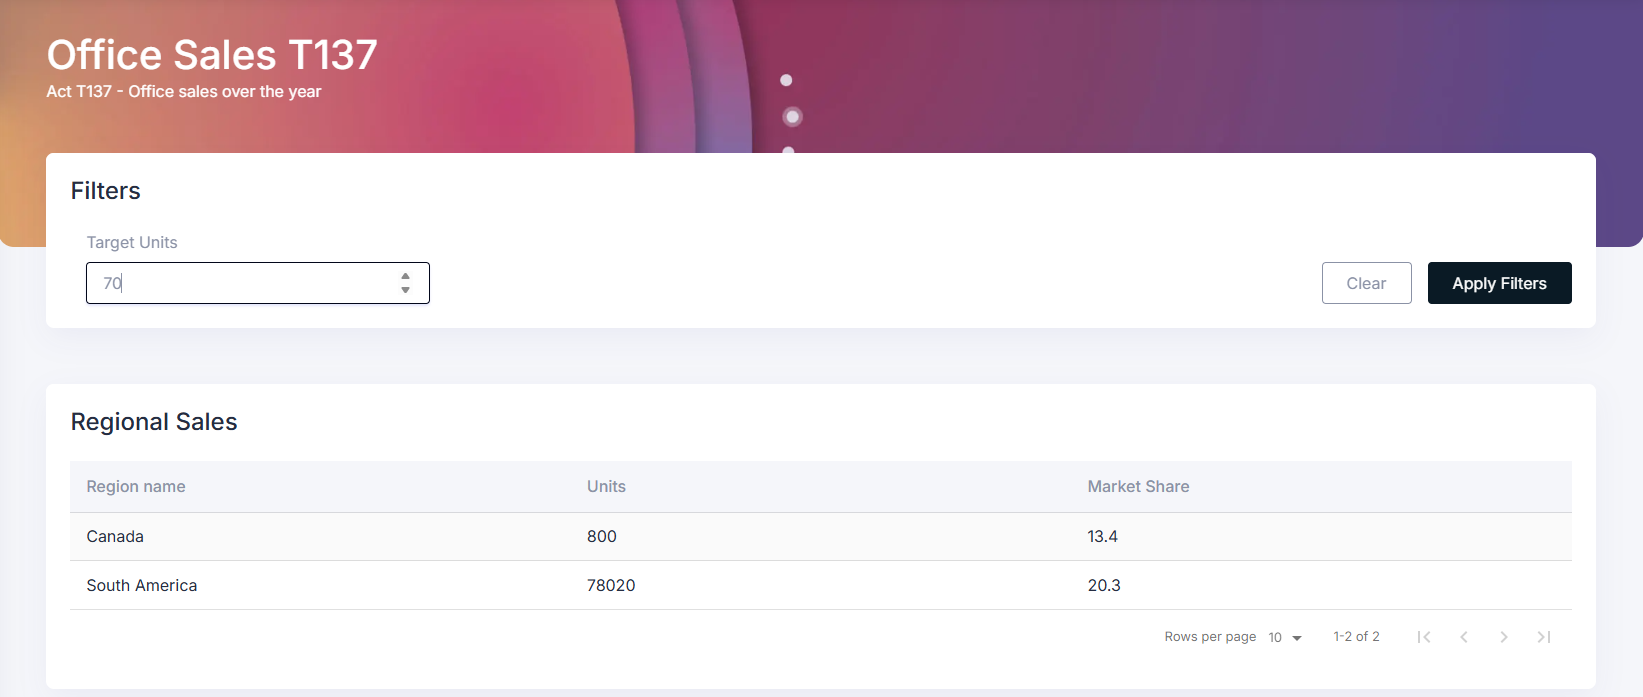
This will open the report in a new page, where you can see the data visualizations and summaries based on the configured sections.
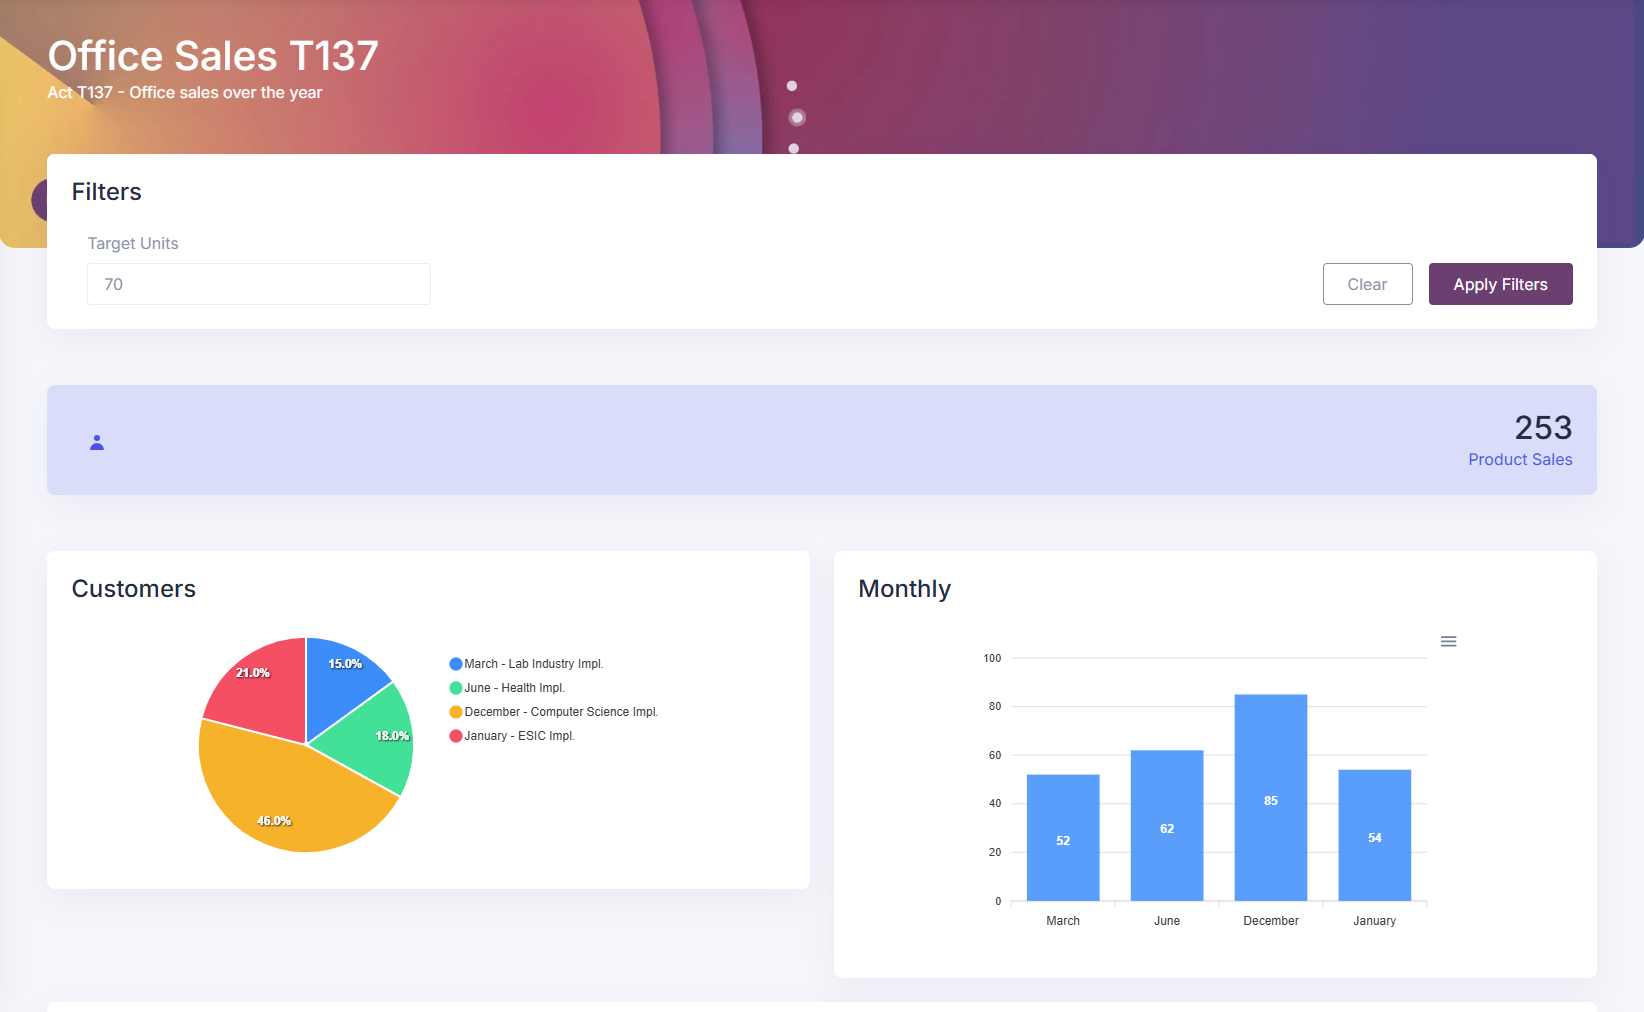
-
By using the filter variables created before, you can refine the data displayed in the report.
How to assign a report to a role?
Section titled “How to assign a report to a role?”To assign a report to a role, go to the Roles module on settings panel. Select the desired role from the top dropdown menu, role in which you want to assign the report.
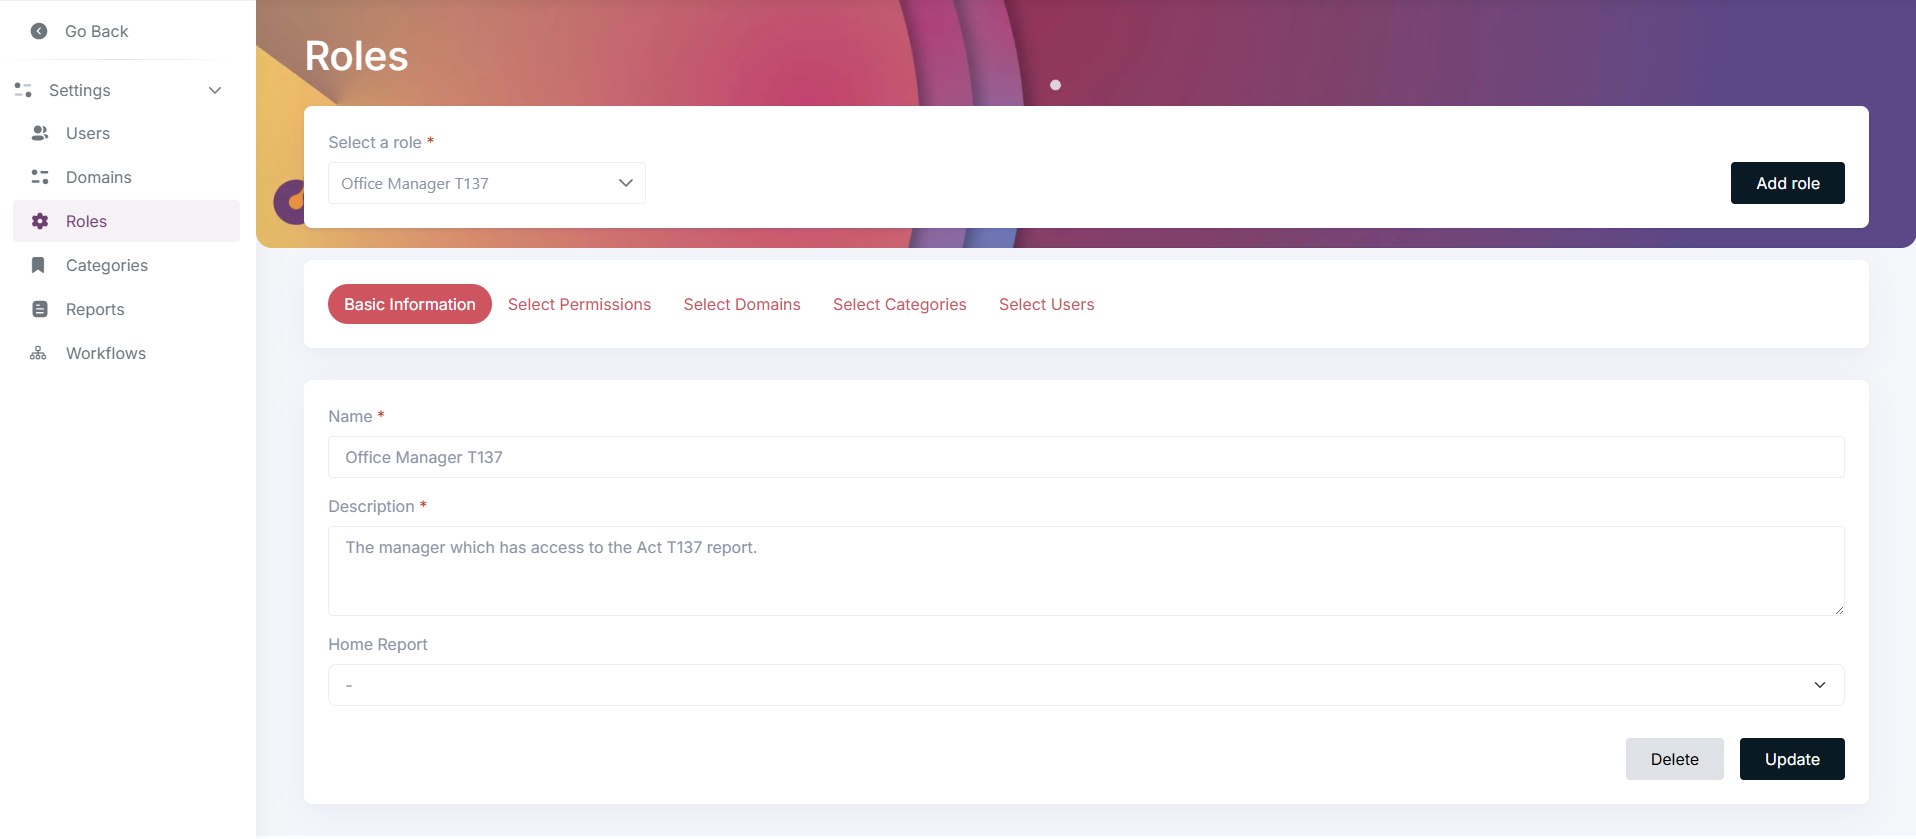
Next, set the “Home Report” field with the desired report to be assigned to the role.
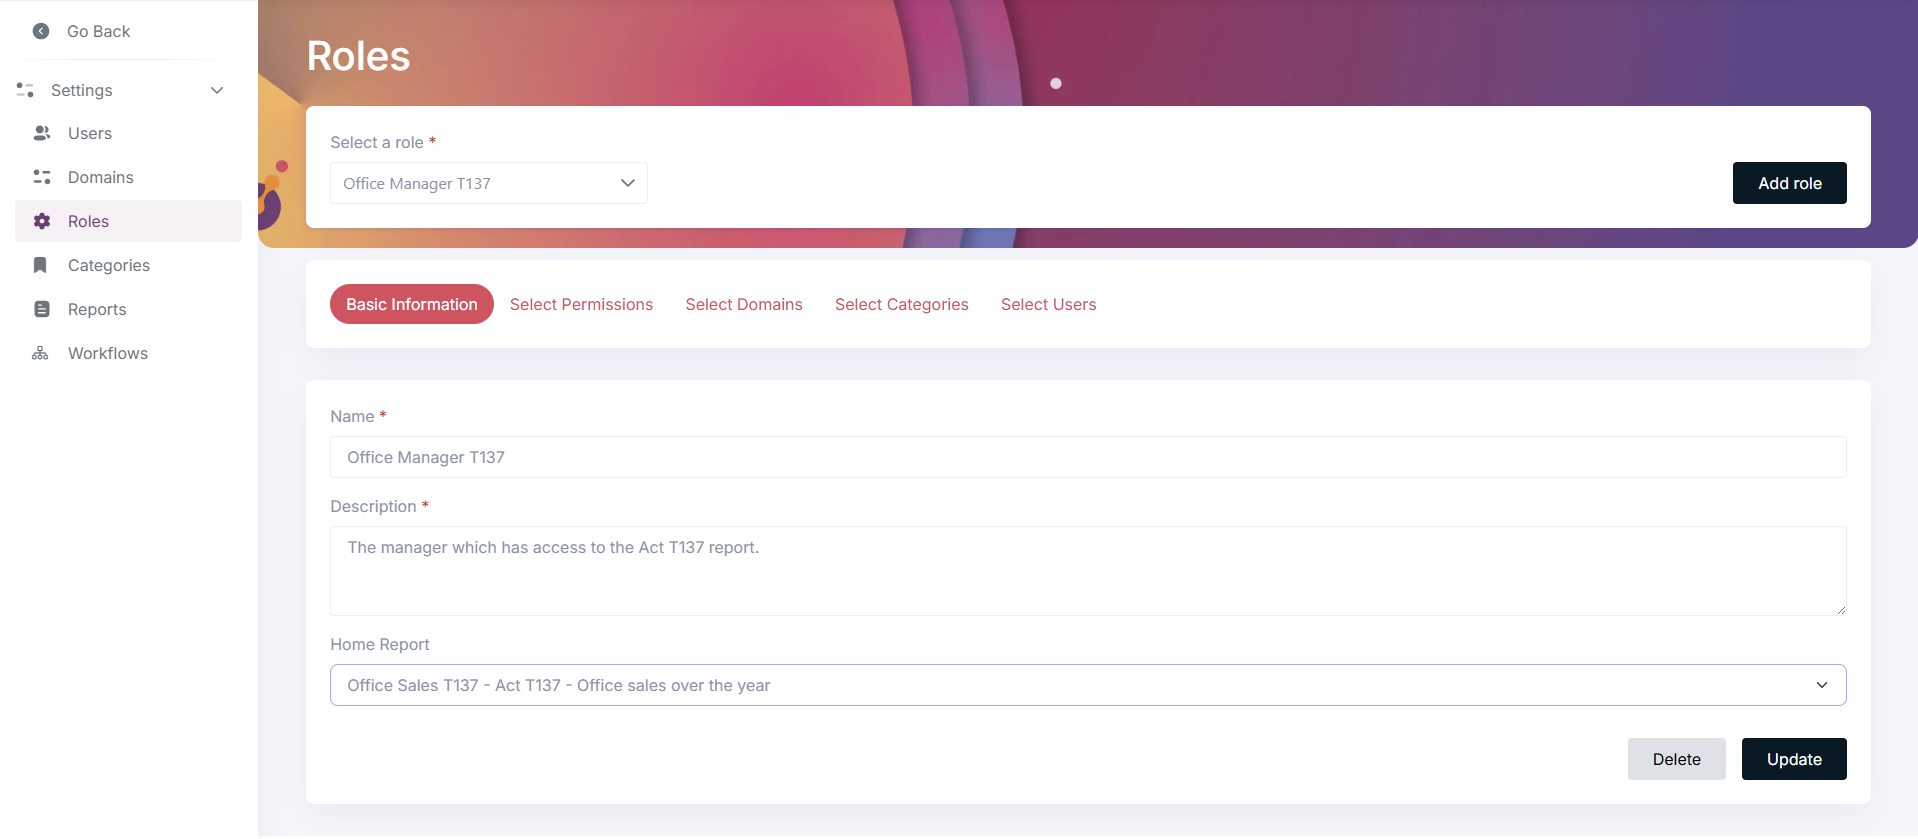
Click on the “Update” button located at the bottom right of the page to save the changes. The role will now have assigned the selected report as home report, which will be displayed in the dashboard when a user with that role logs in.
Tips and common mistakes
Section titled “Tips and common mistakes”- Use the filter input at the top of the Reports module to quickly find the report you are looking for.
- Remember to save the report after making changes by clicking on the “Save” button located at the bottom right of the page.
- When using the “Include entity” option in the Custom Query Builder, ensure that the join fields are correctly selected to avoid incorrect data retrieval.
- The default operator for rules is “equals”, but you can change it by clicking on the operator dropdown.
- When creating variables for report filters, use descriptive names to easily identify their purpose. Numeric label values are also supported.
- Experiment with different section types and configurations to find the best way to visualize your data. Each type of section (Table, Pie Chart, Bar Chart, Counter) has its own strengths and use cases, so try them out to see which one works best for your specific reporting needs.
My report is not showing sections within it, what can I do?
Section titled “My report is not showing sections within it, what can I do?”- Ensure that you have added sections to the report and configured them correctly.
- Ensure the data source entities selected for each section has data available.
- Change your filter criteria to be less restrictive, or remove them temporarily to check that data is being fetched.
- If you are using the Custom Query Builder, double-check your query logic, joins, and rules to ensure they are correctly set up to retrieve the desired data.