Reports
Reports are a tool for generating and viewing data summaries and insights within the application. They allow users to create custom reports based on various data sources and criteria.
How to access the Reports module?
Section titled “How to access the Reports module?”To access the Reports module, you can use the global navigation or the settings panel. First, go to the settings page by clicking on the profile icon in the top right corner and selecting “Settings”.
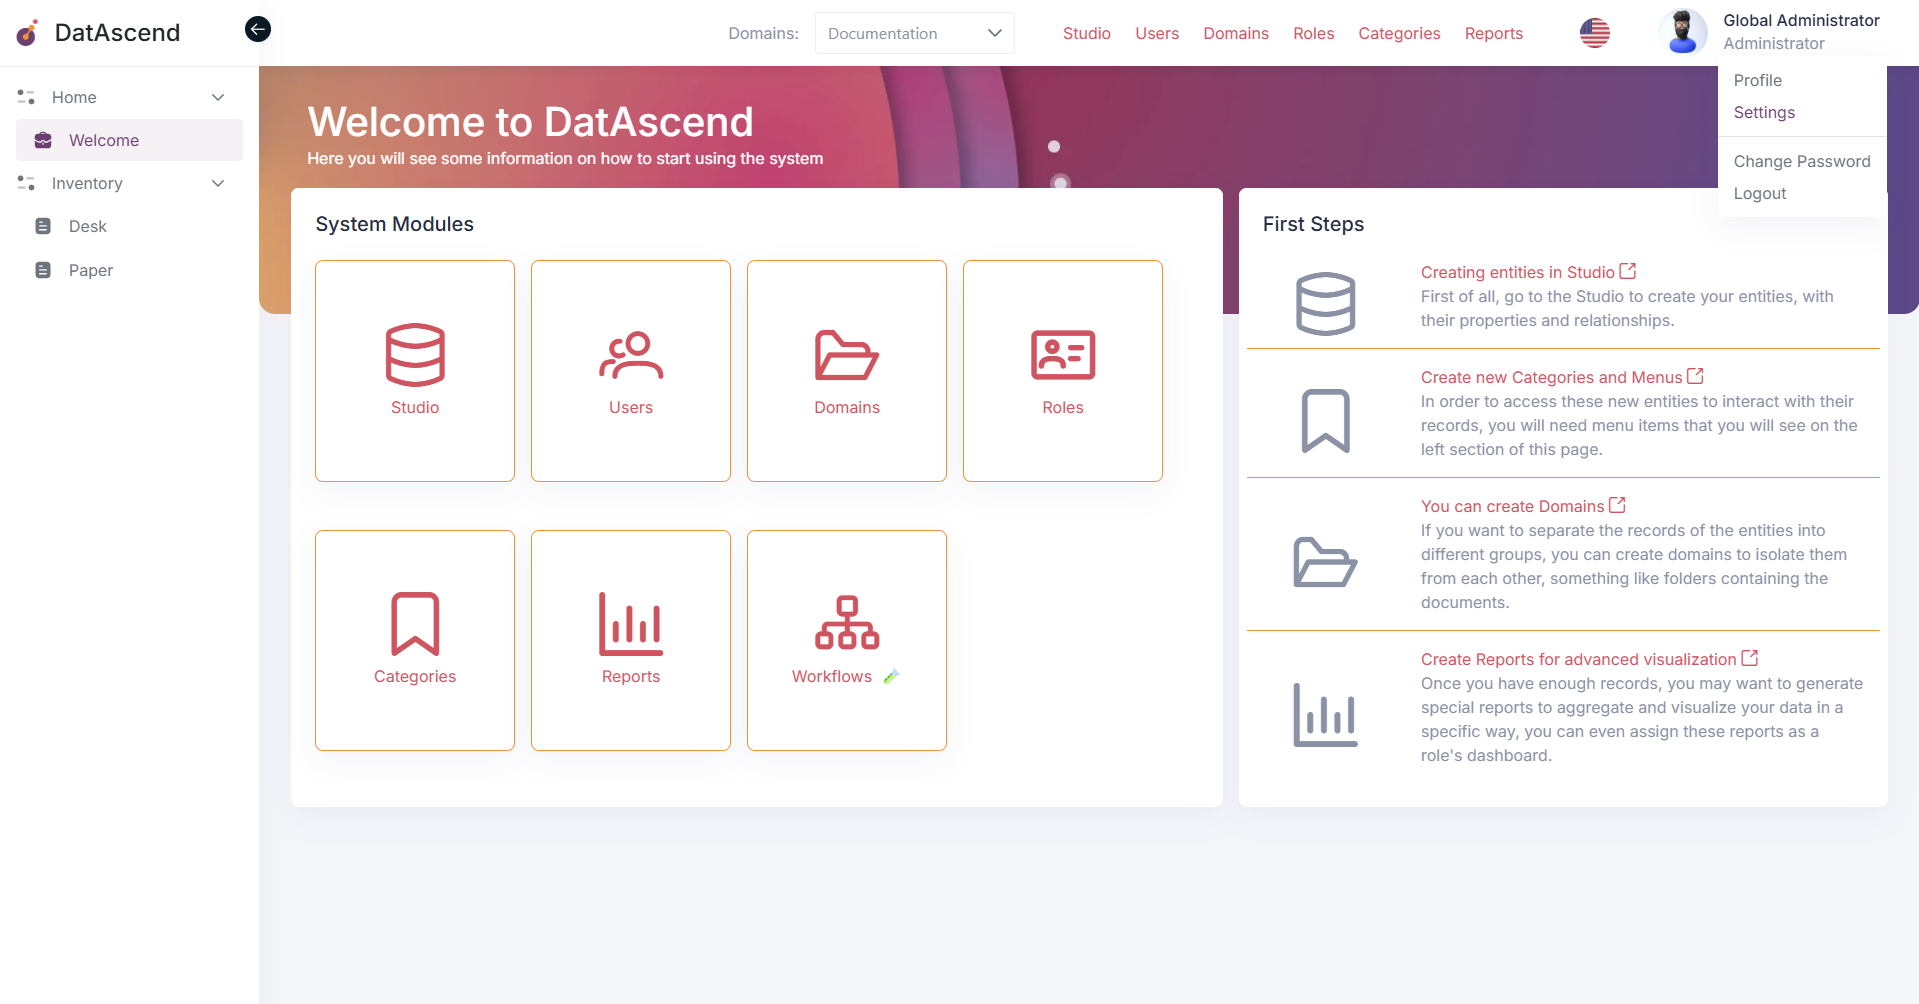
Then, in the settings panel, you will find the “Reports” option in the sidebar.
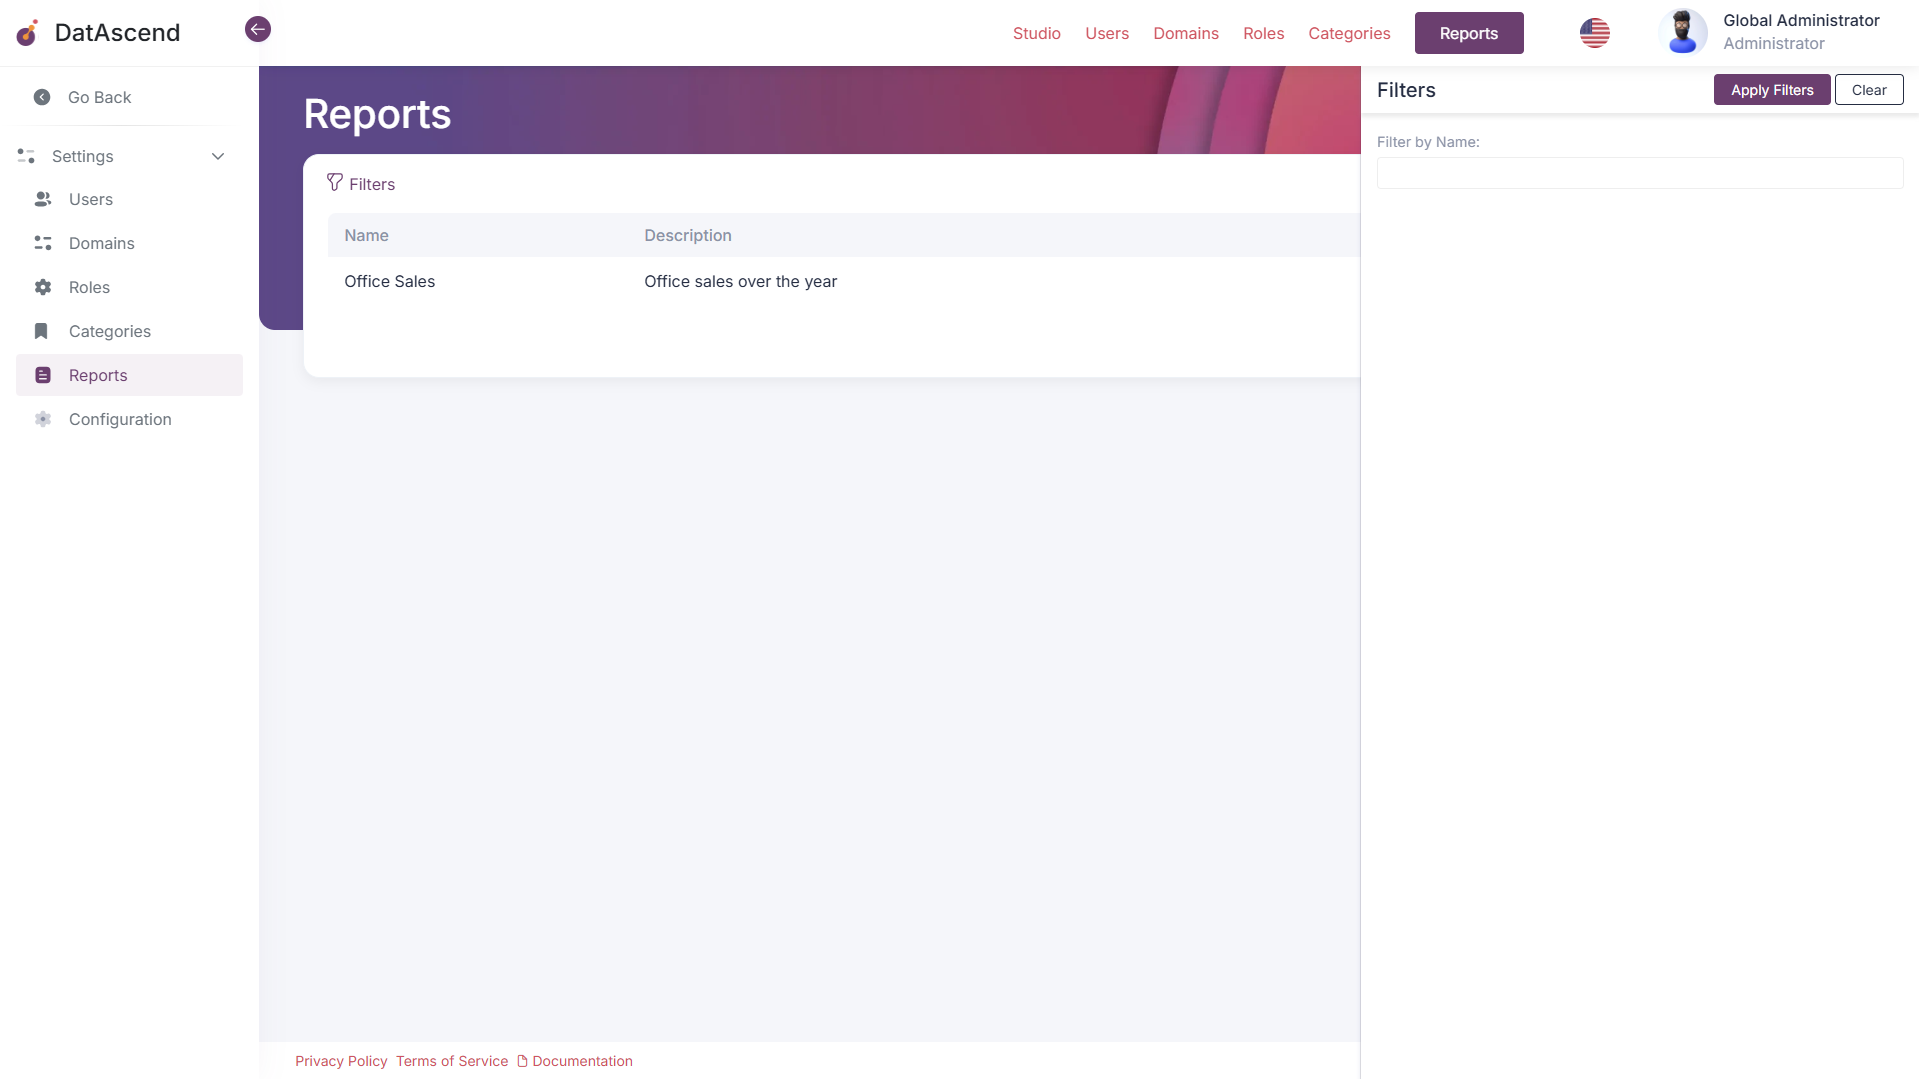
Using the filter button, a side panel will open with a search input to find the report you are looking for, if any.
How to create a new Report?
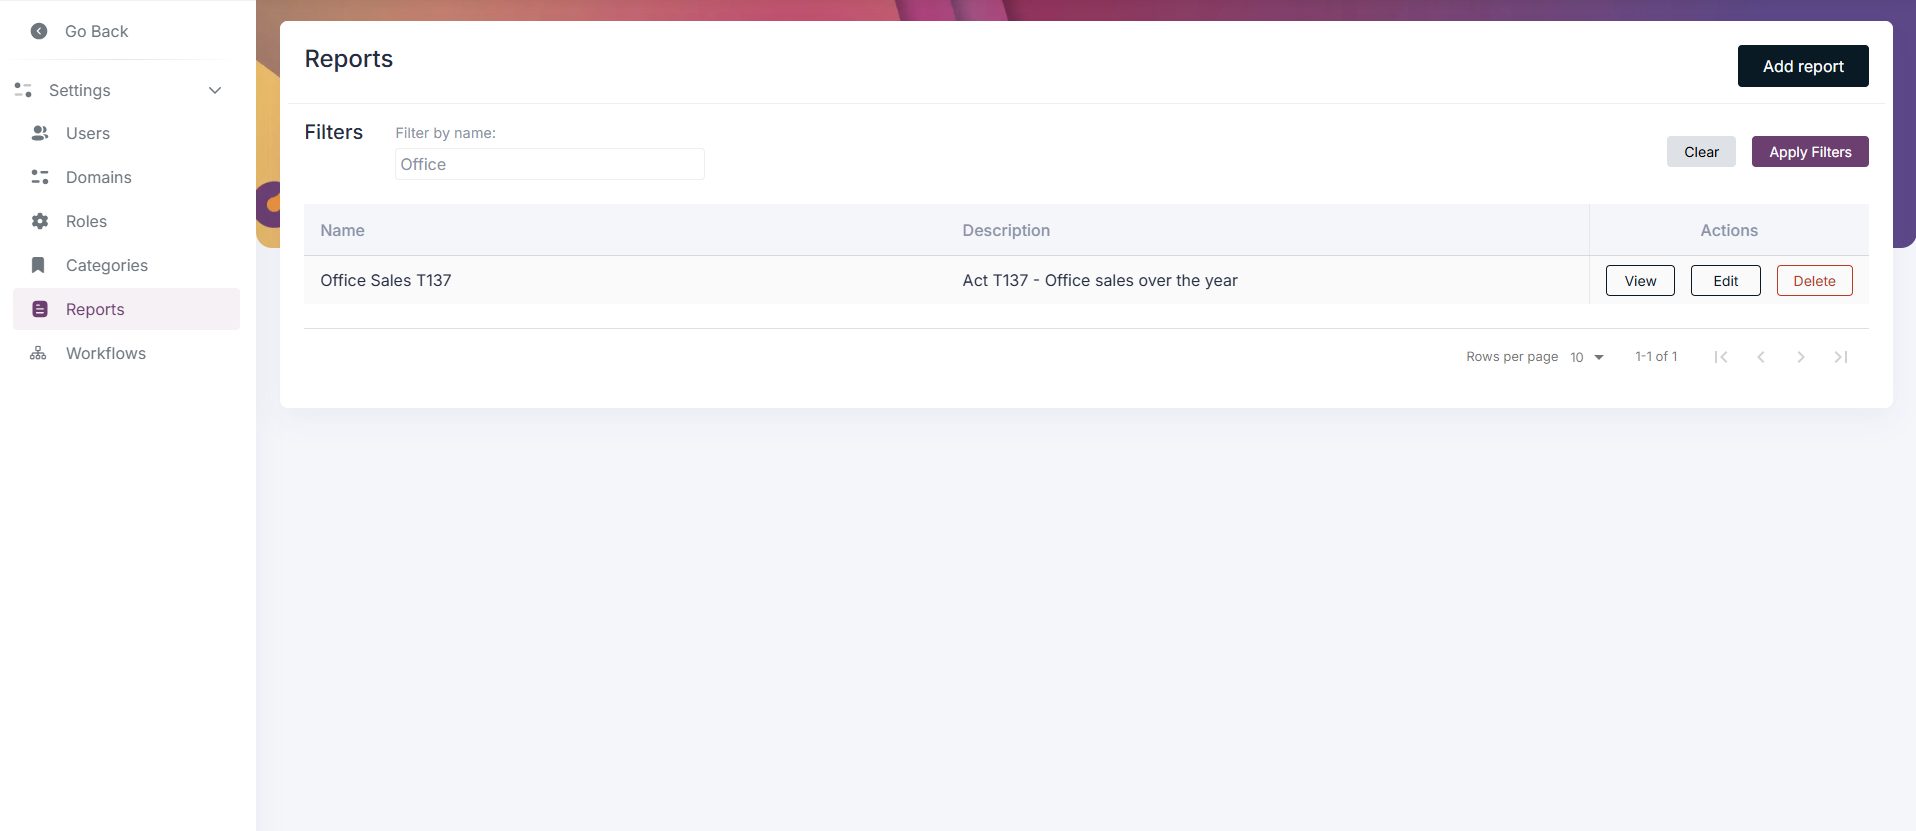
Section titled “How to create a new Report?”To create a new Report, click on the “Add Report” button located at the top right corner of the page.
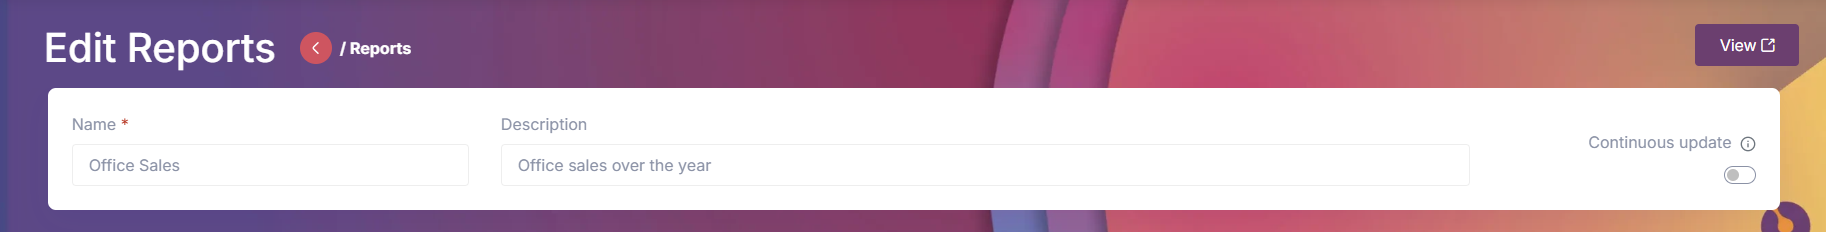
The next screen will display a form where you can enter the details of the new report, such as name, description, and filter criteria. The switch button for “Continuous update” allows the report to automatically refresh its data at regular intervals, ensuring that the displayed information is always up to date without requiring manual refreshes. Each of the fields for filter criteria can be configured to refine the data that will be included in the report.
First, it is possible to create a variable that will be used in the report.
For example, you can create a variable for the date range or specific user segments. Start by clicking on the “Add Variable” button. Next, fill in the variable name, label, and type.
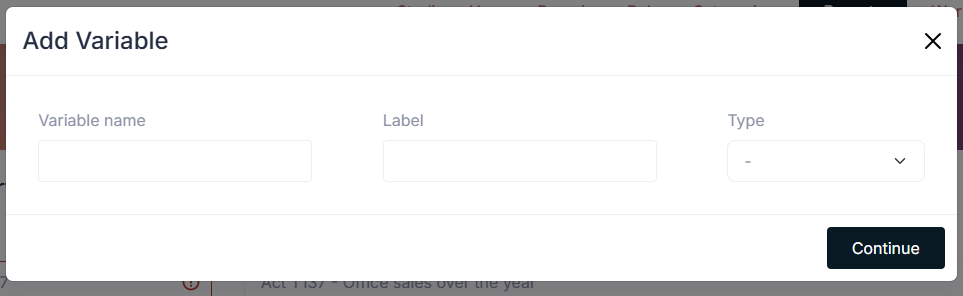
The types available for variable creation are:
- Date and Time
- Boolean
- String
- Number
- Date
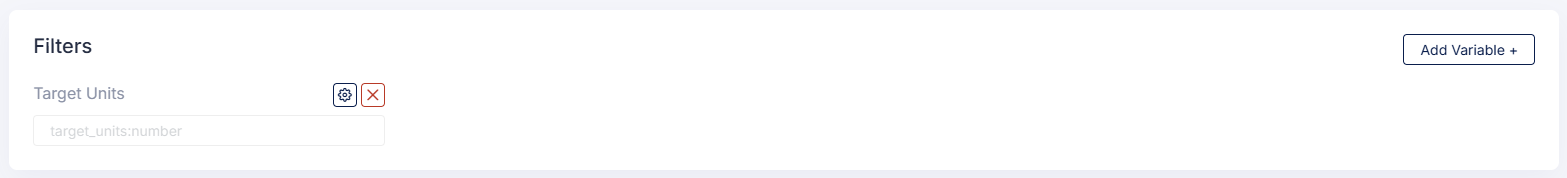
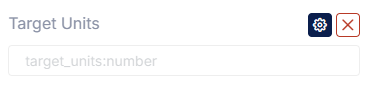
After filling in the form, click on the “Continue” button to proceed. The variable will now be listed in the variables section. It is also possible to edit or delete a variable by clicking on the respective icons next to each variable in the list.
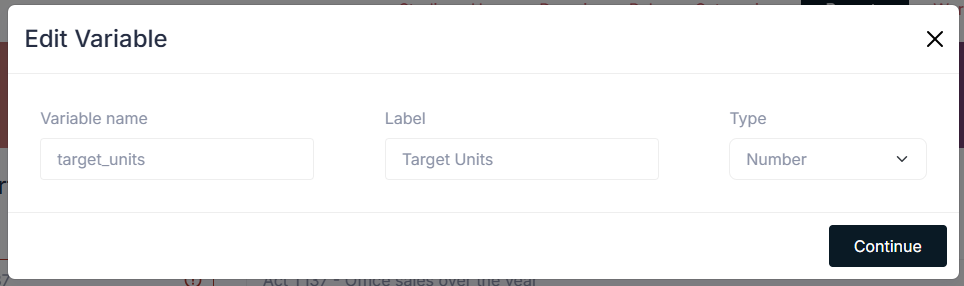
When a variable is edited, a modal will appear with the variable details. You can modify the name, label, and type of the variable.
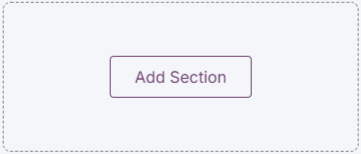
Next, the report can be configured by adding the necessary sections to be included in the report. To add a section, click on the “Add Section” button.
You can choose from different types of sections, as shown below:
- Table: This section will display the data in a tabular format.
- Pie Chart: This section will display a pie chart to visualize the data distribution from a specific field.
- Bar Chart: This section will display a bar chart to visualize data trends over time or across categories.
- Counter: This section will display a single value, such as a total count or sum over a field.
The configuration options for each section will vary depending on the type of section selected. This guide will demonstrate how to configure each type of section.
Counter Section
Section titled “Counter Section”-
Create a new section.
-
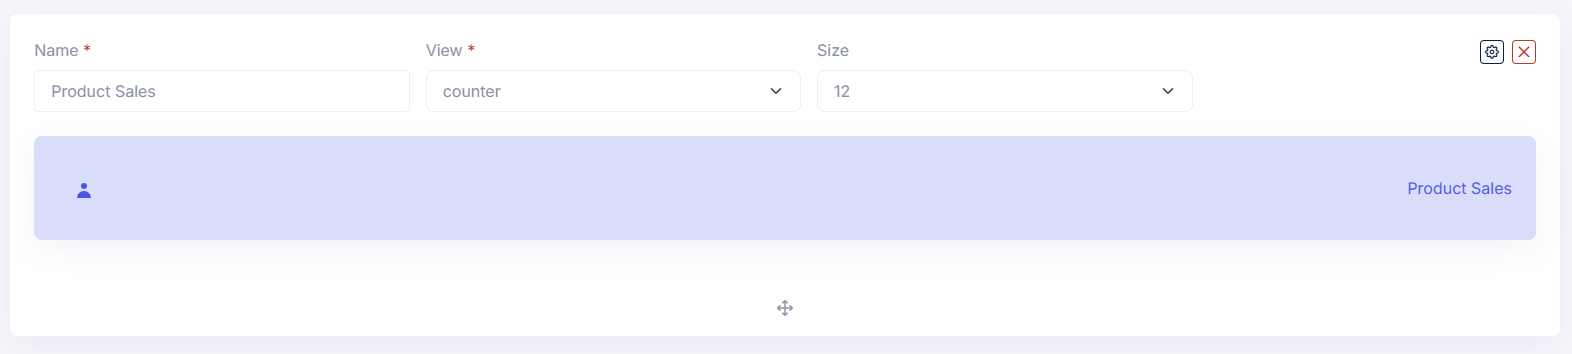
Select “Counter” as the view type.
-
Fill in the section name and size (from 1 to 12).
-
Use the gear icon to open the configuration modal in the top right corner of the section.
-
In the configuration modal, select the data source for the counter. This will be the entity from which the data will be fetched.
- Optionally, you can apply filters to the data by clicking on the ”+ Rule” button and selecting the desired criteria.
- Optionally, you can use variables created earlier in the rules for the counter display.
-
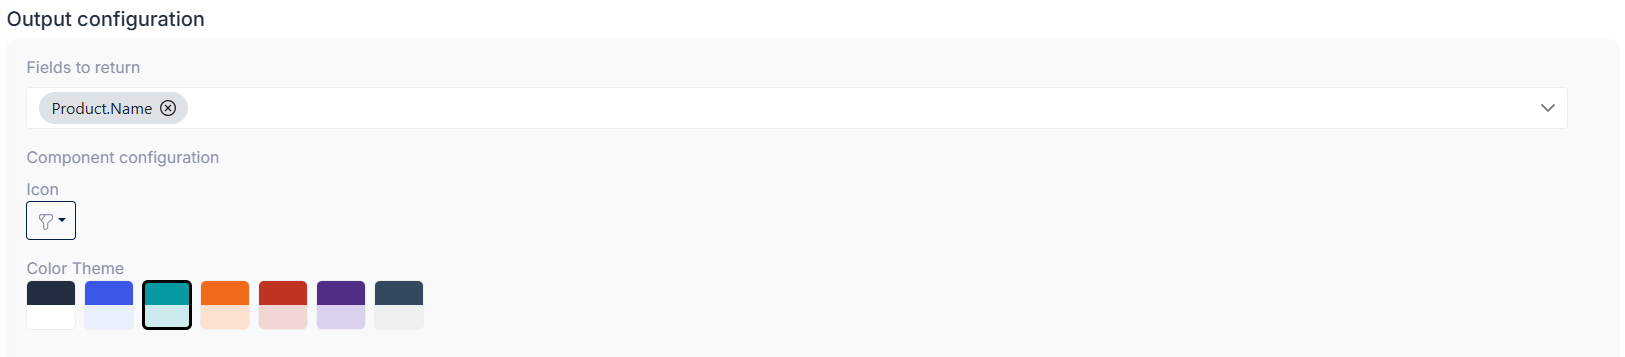
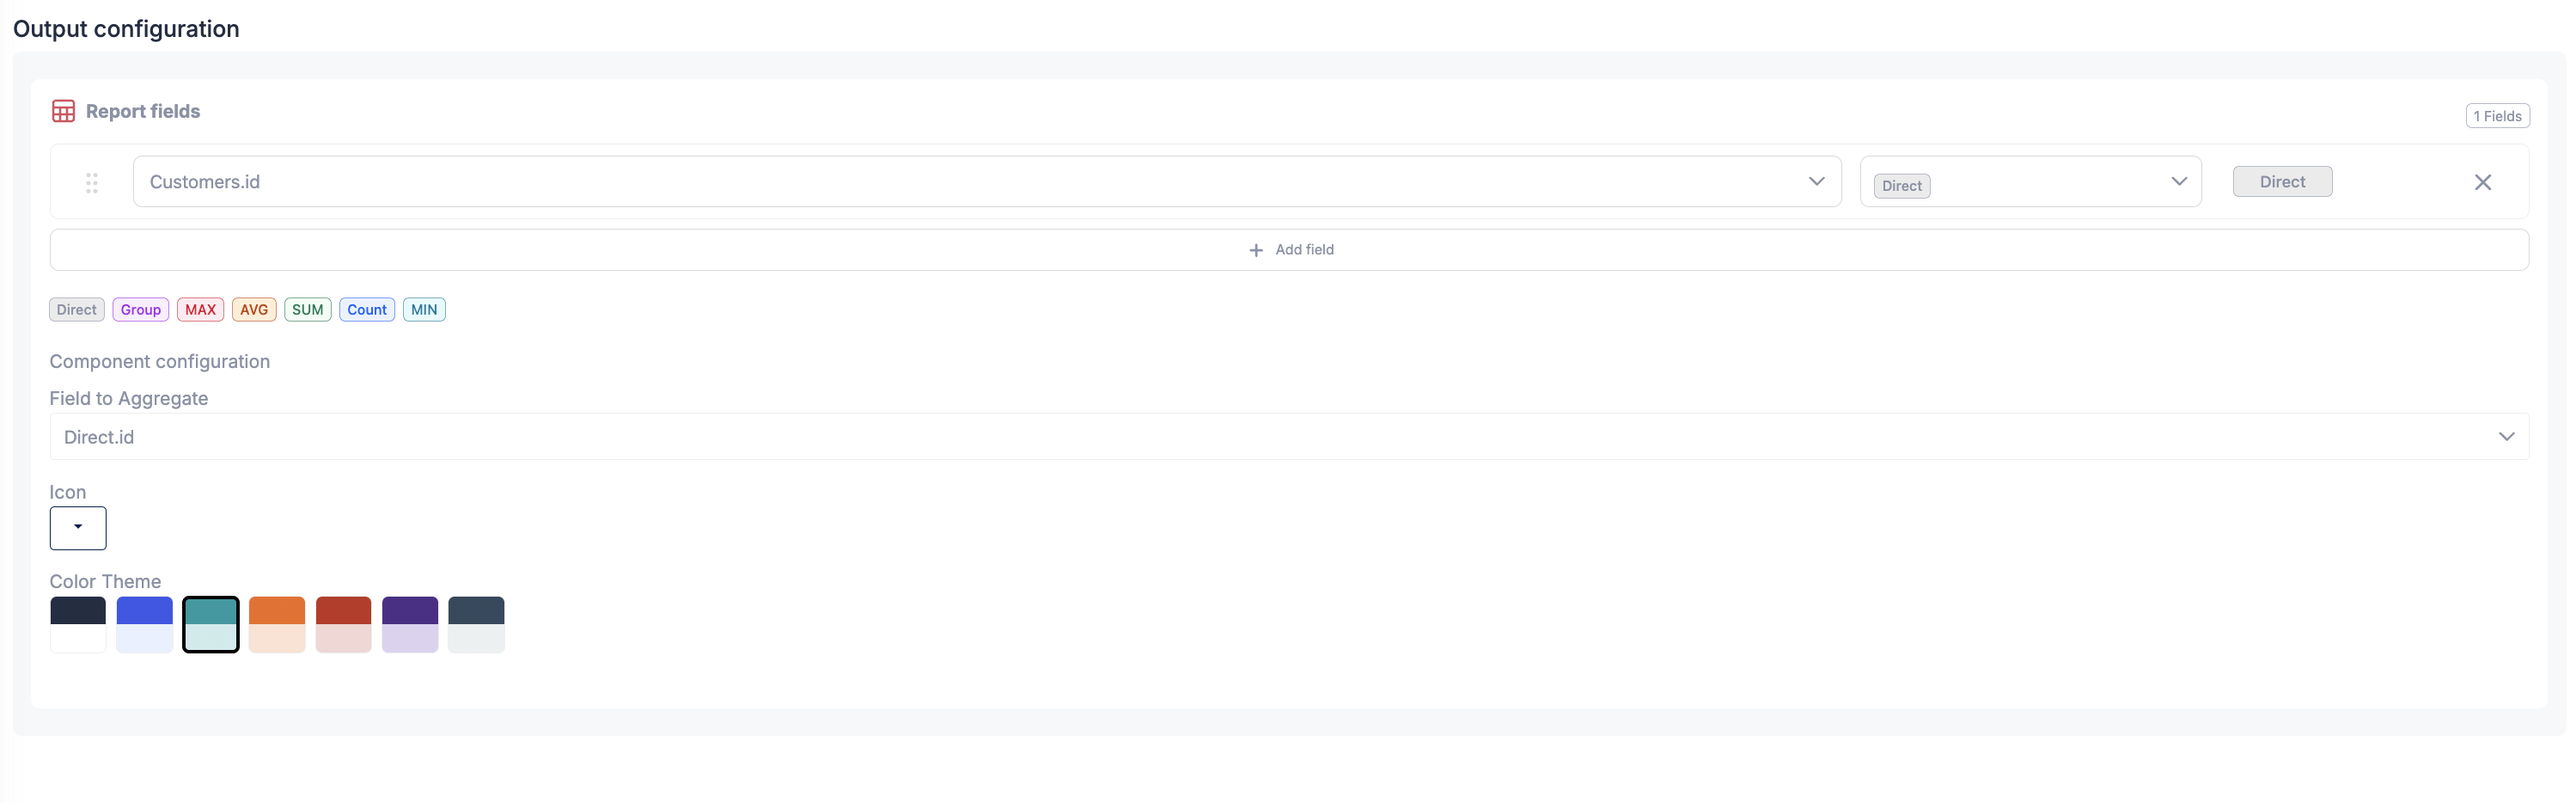
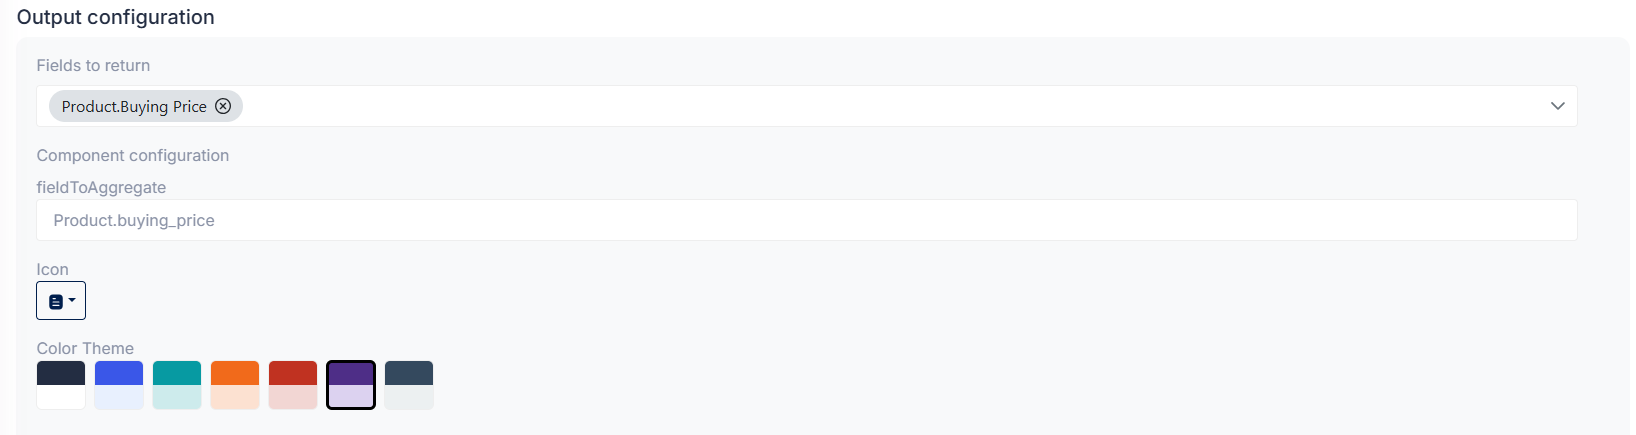
Next, configure the Report fields for the section.
- Add a row by clicking on add field button and select the field from the field dropdown.
- Then choose the operation to apply from the operation dropdown.
- The available operations include
Direct,Group,Count,SUM,AVG,MIN, andMAX. - For Counter sections, aggregation operations such as
Count,SUM,AVG,MIN, orMAXare commonly used to display a single summarized value. Directreturns the field without aggregation.- The rows can be reordered by dragging them.
- The icon for the section can also be selected in this step.
- The color for the section display can also be selected in this step.
-
Click on the close icon in the top right corner to save the configuration.
-
Remember to save the report by clicking on the “Save” button located at the bottom right of the page.
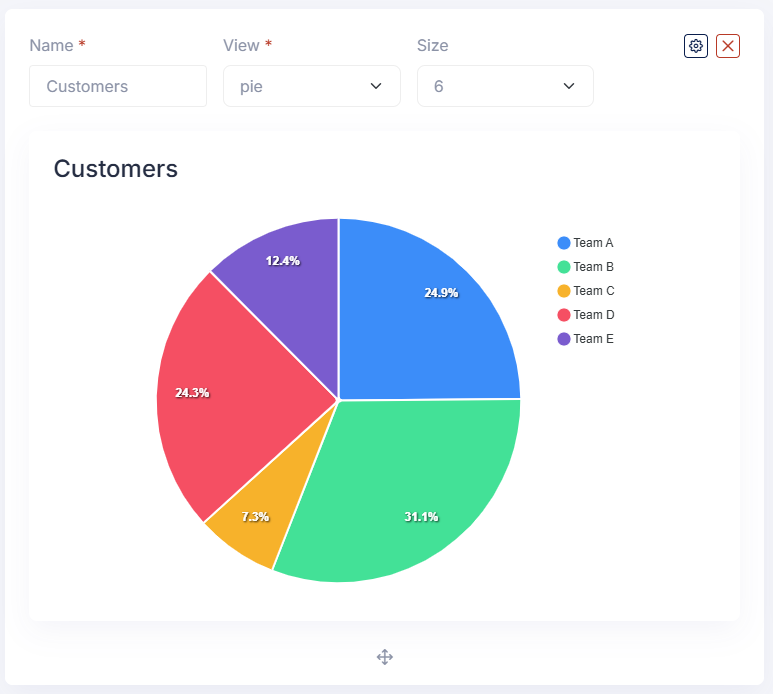
Pie Chart Section
Section titled “Pie Chart Section”-
Create a new section.
-
Select “Pie Chart” as the view type.
-
Fill in the section name and size (from 1 to 12).
-
Use the gear icon to open the configuration modal in the top right corner of the section.
-
In the configuration modal, select the data source for the pie chart. This will be the entity from which the data will be fetched.
- Optionally, you can apply filters to the data by clicking on the ”+ Rule” button and selecting the desired criteria.
- Optionally, you can use variables created earlier in the rules for the pie chart display.
-
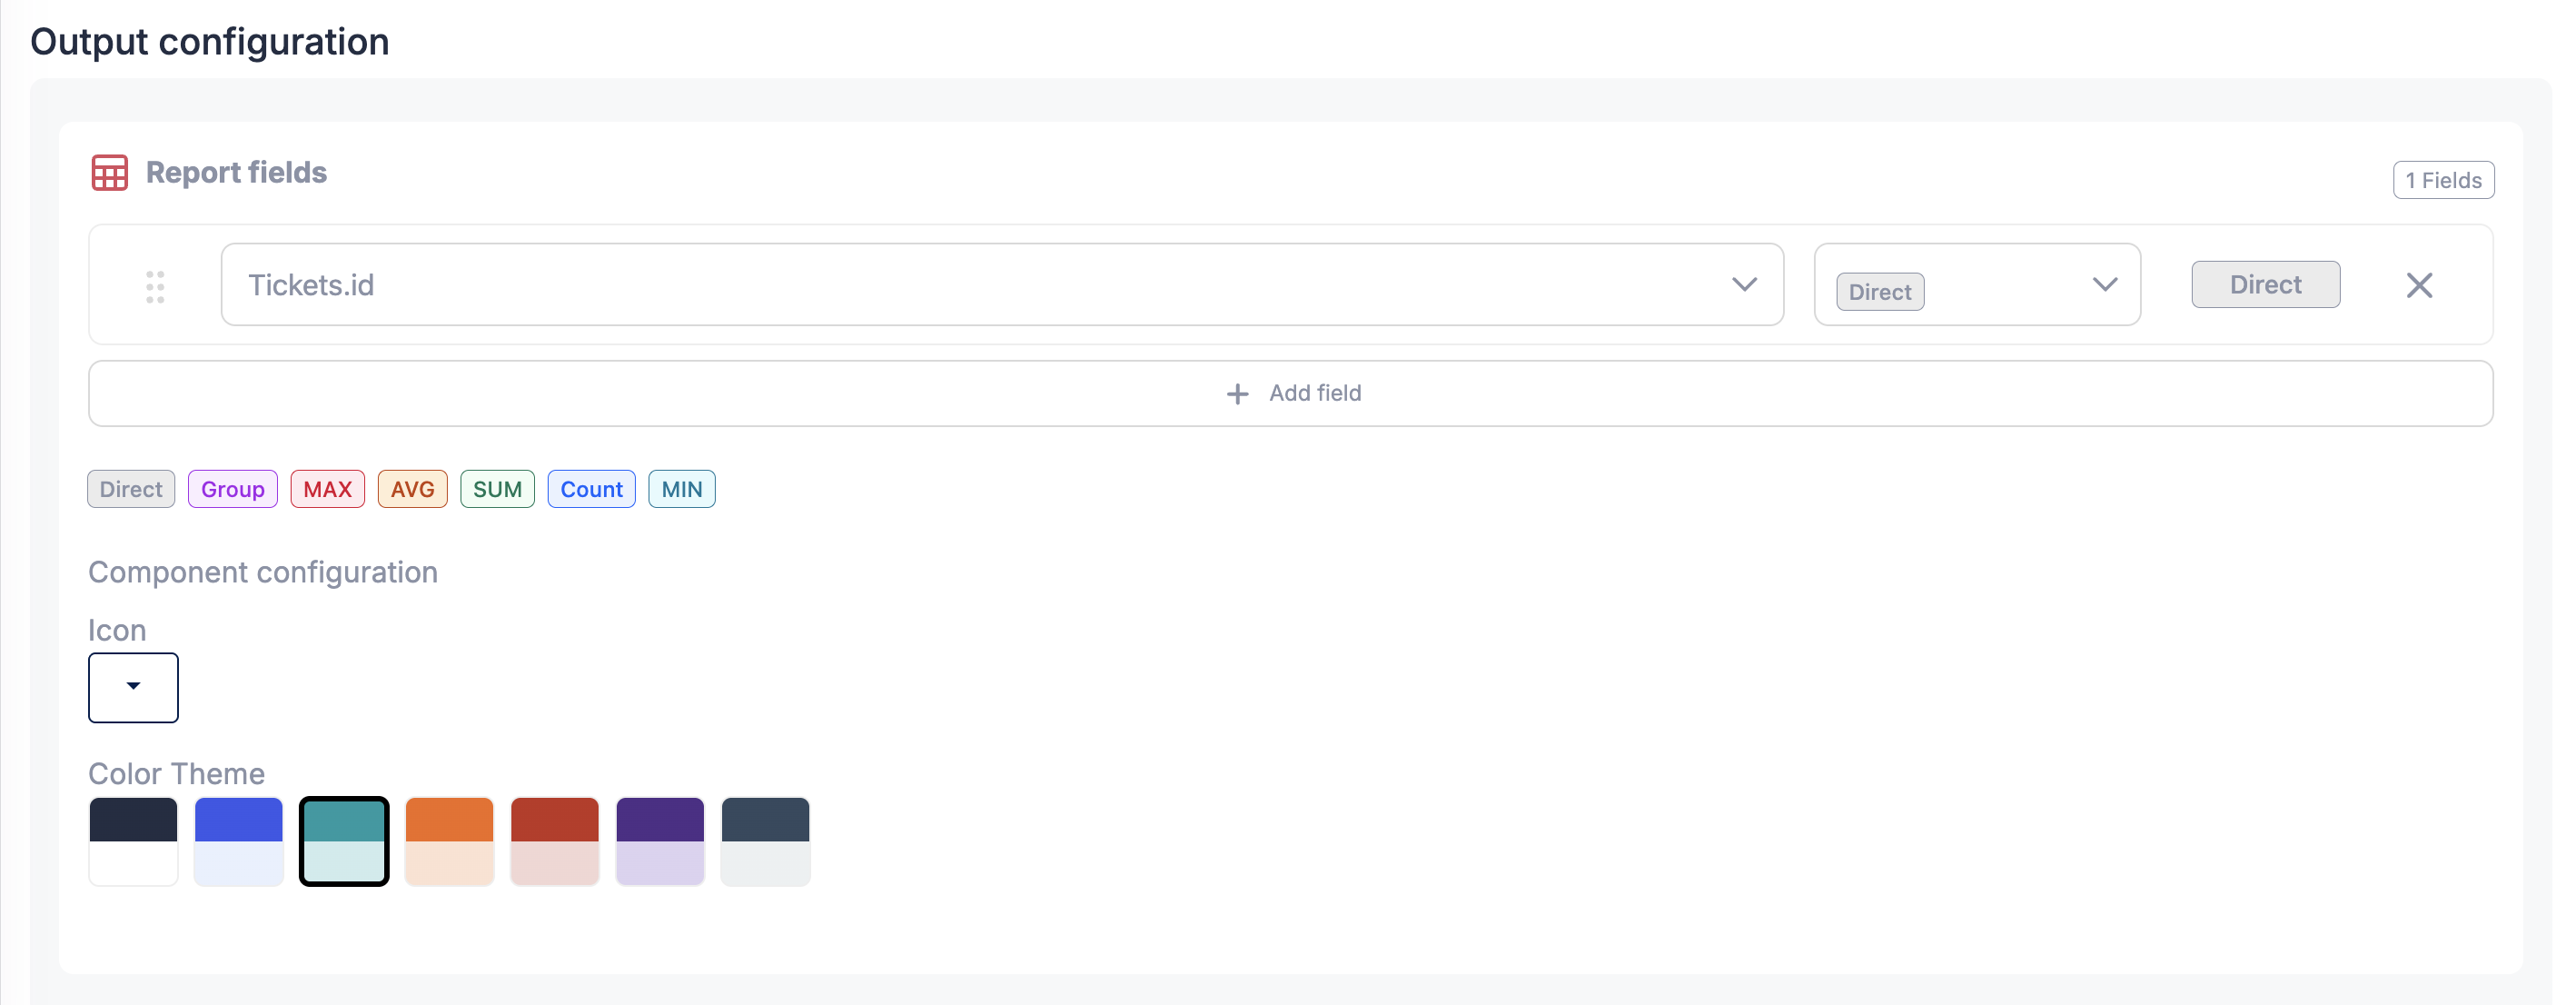
Next, configure the Report fields for the section.
- Add one or more rows by clicking add field button in the Report fields area.
- For each row, select a field and then choose the operation to apply.
- The available operations include
Direct,Group,Count,SUM,AVG,MIN, andMAX. - In most pie chart use cases, one field is configured with
Groupto define the slices, and another field is configured with an aggregation such asCountorSUMto define the slice size. Directreturns the field without aggregation.- The rows can be reordered by dragging them.
- The icon for the section can also be selected in this step.
- The color for the section display can also be selected in this step.
-
Click on the close icon in the top right corner to save the configuration.
-
Remember to save the report by clicking on the “Save” button located at the bottom right of the page.
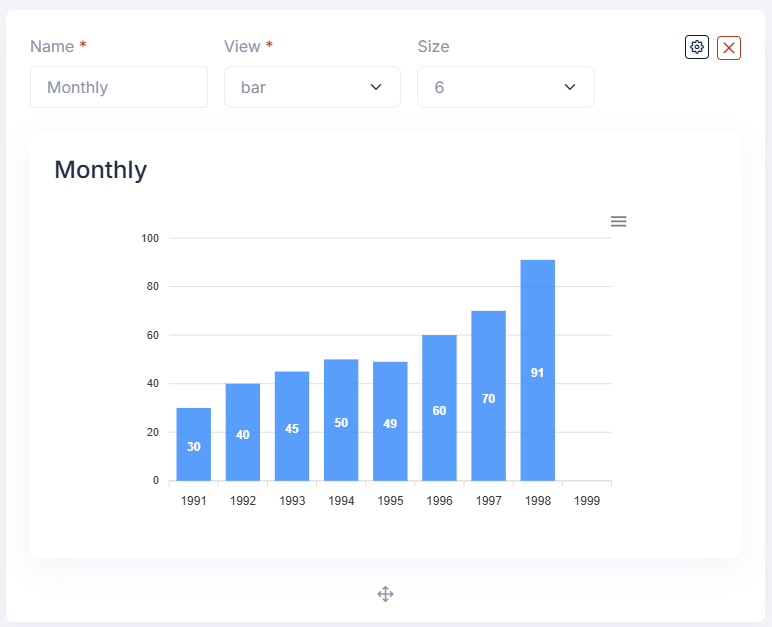
Bar Chart Section
Section titled “Bar Chart Section”-
Create a new section.
-
Select “Bar Chart” as the view type.
-
Fill in the section name and size (from 1 to 12).
-
Use the gear icon to open the configuration modal in the top right corner of the section.

-
In the configuration modal, select the data source for the bar chart. This will be the entity from which the data will be fetched.
- Optionally, you can apply filters to the data by clicking on the ”+ Rule” button and selecting the desired criteria.
- Optionally, you can use variables created earlier in the rules for the bar chart display.
-
Next, configure the Report fields for the section.
- Add one or more rows by clicking add field button in the Report fields area.
- For each row, select a field and then choose the operation to apply.
- The available operations include
Direct,Group,Count,SUM,AVG,MIN, andMAX. - In most bar chart use cases, one field is configured with
Groupto define the bar categories, and another field is configured with an aggregation such asCount,SUM, orAVGto define the bar height. Directreturns the field without aggregation.- The rows can be reordered by dragging them.
- The icon for the section can also be selected in this step.
- The color for the section display can also be selected in this step.
-
Click on the close icon in the top right corner to save the configuration.
-
Remember to save the report by clicking on the “Save” button located at the bottom right of the page.
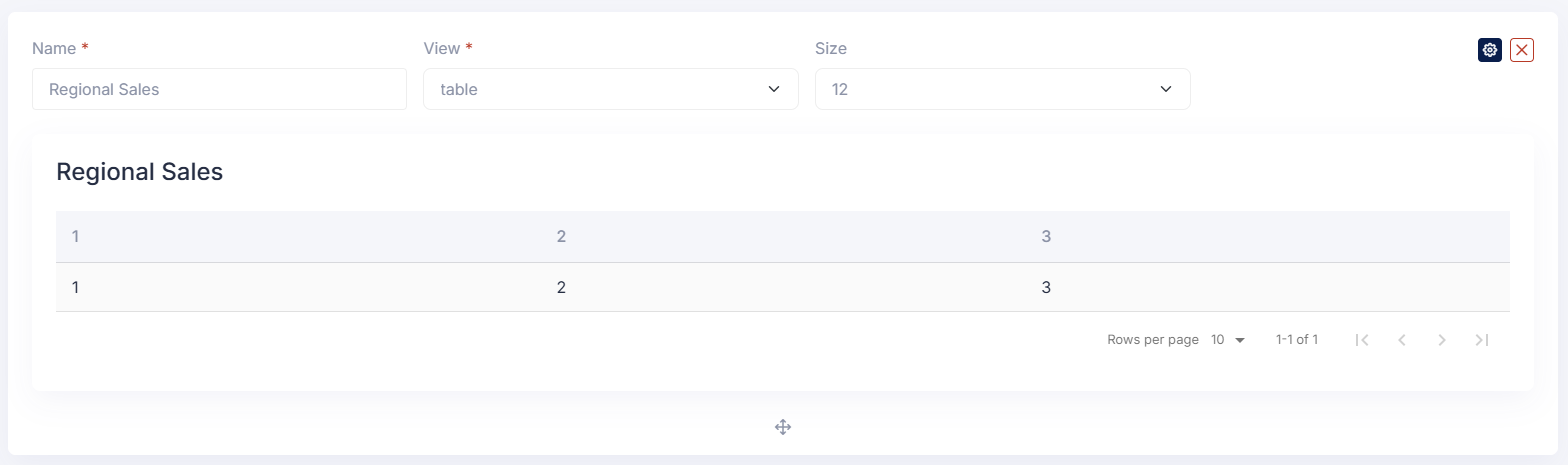
Table Section
Section titled “Table Section”-
Create a new section.
-
Select “Table” as the view type.
-
Fill in the section name and size (from 1 to 12).
-
Use the gear icon to open the configuration modal in the top right corner of the section.
-
In the configuration modal, select the data source for the table. This will be the entity from which the data will be fetched.
- Optionally, you can apply filters to the data by clicking on the ”+ Rule” button and selecting the desired criteria.
- Optionally, you can use variables created earlier in the rules for the table display.
-
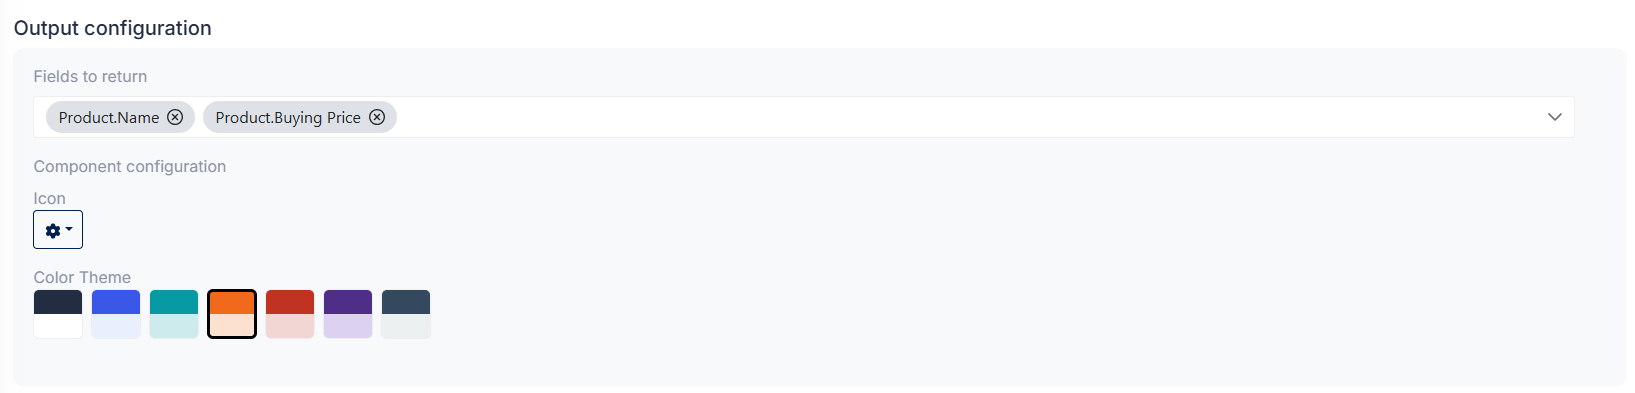
Next, configure the Report fields for the section.
- Each row represents one column or returned value in the query.
- Select the field from the field dropdown.
- Then choose the operation to apply from the operation dropdown.
- The available operations include
Direct,Group,Count,SUM,AVG,MIN, andMAX. Directreturns the original field value without aggregation.Groupcan be used when the table should display grouped results.- Aggregation operations can be used to display summarized values in the table.
- The rows can be reordered by dragging them. In table sections, this order determines the order of the columns shown in the table.
- The icon for the section can also be selected in this step.
- The color for the section display can also be selected in this step.
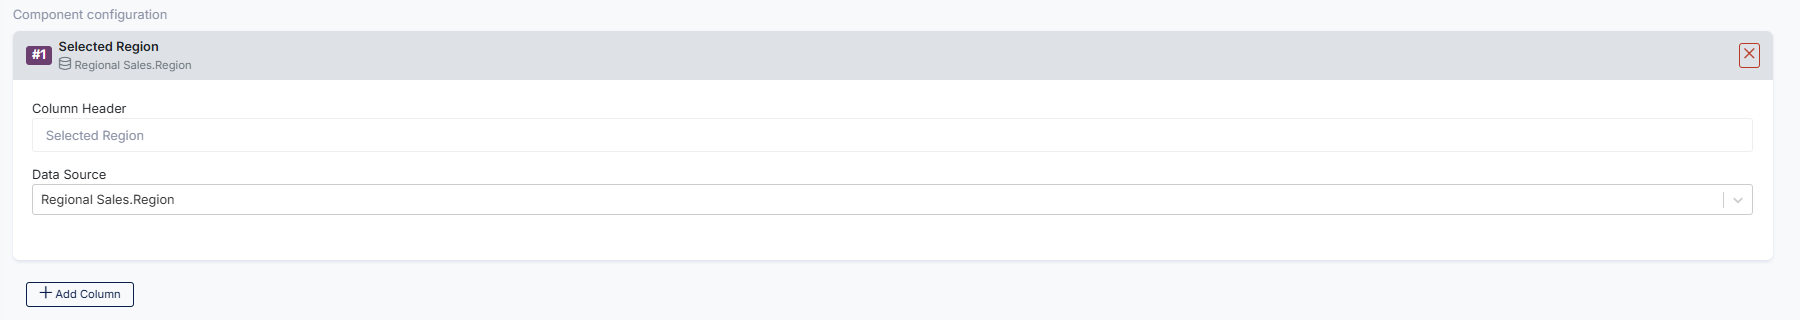
- The columns shown by the table component can also be configured by adding or removing rows in this step.
-
Click on the close icon in the top right corner to save the configuration.
-
Remember to save the report by clicking on the “Save” button located at the bottom right of the page.
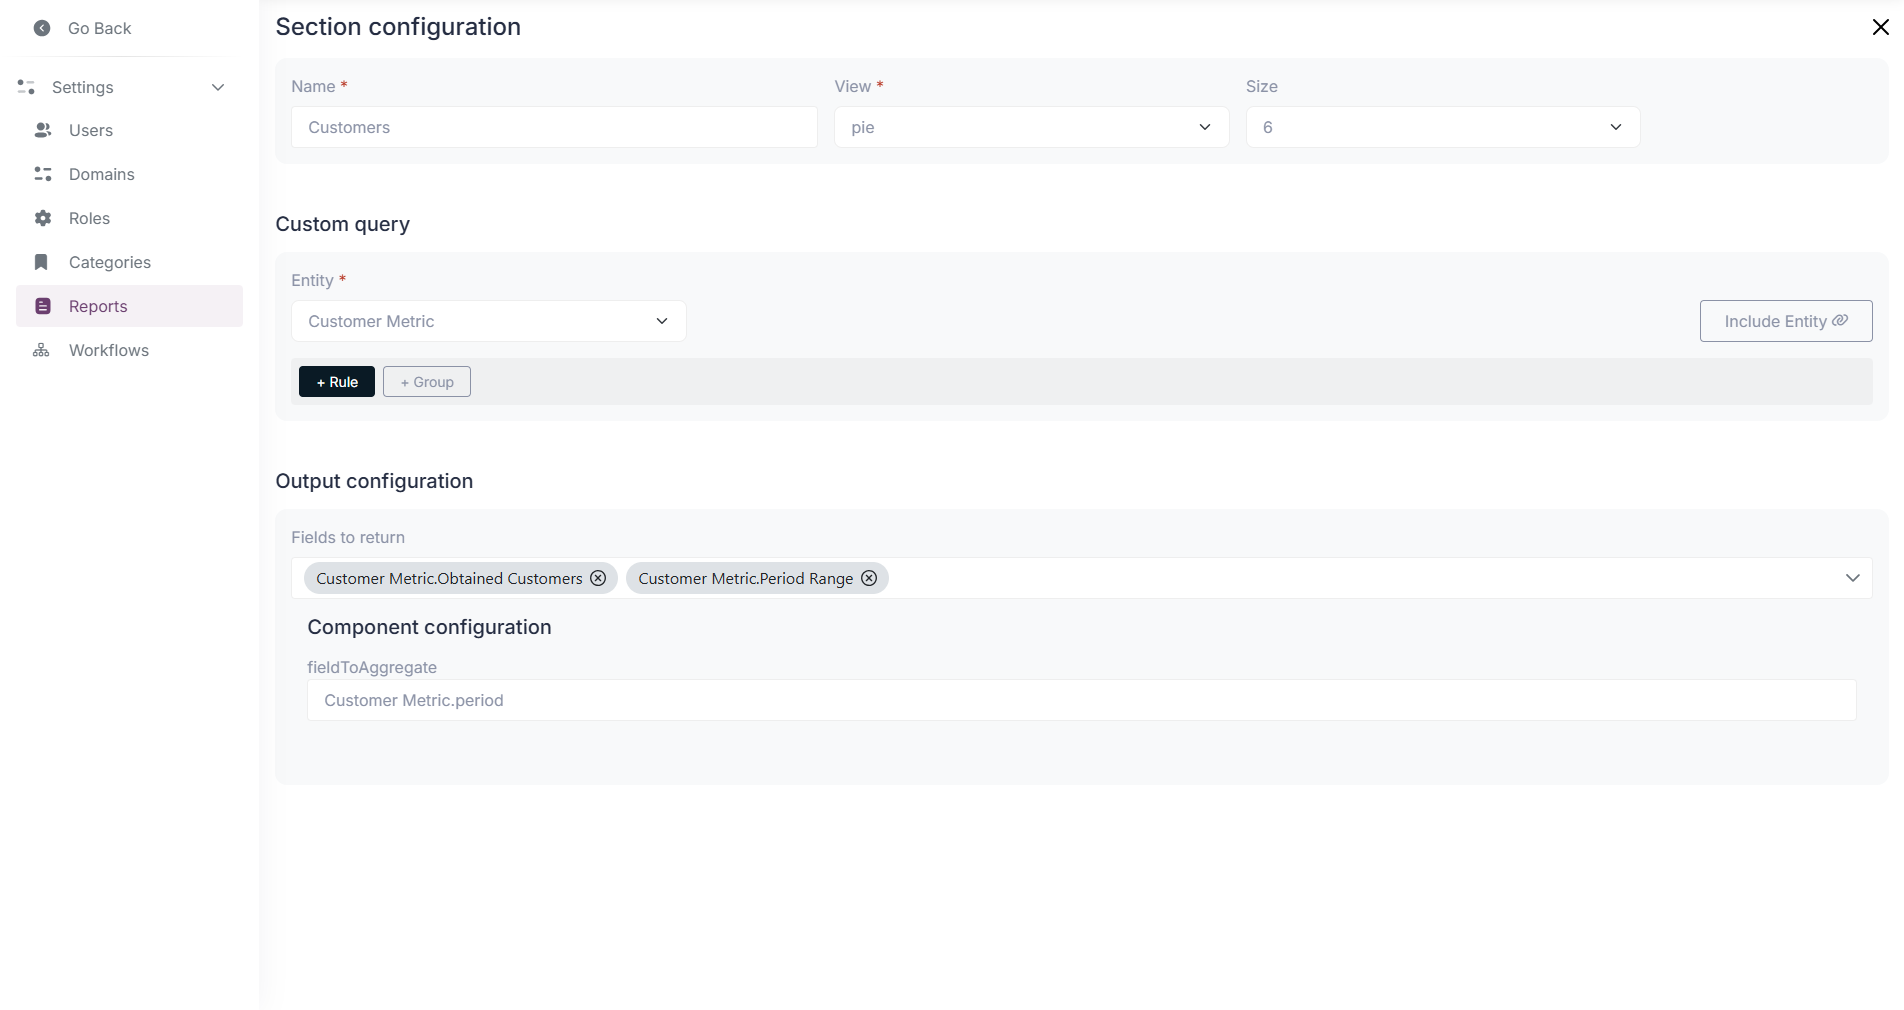
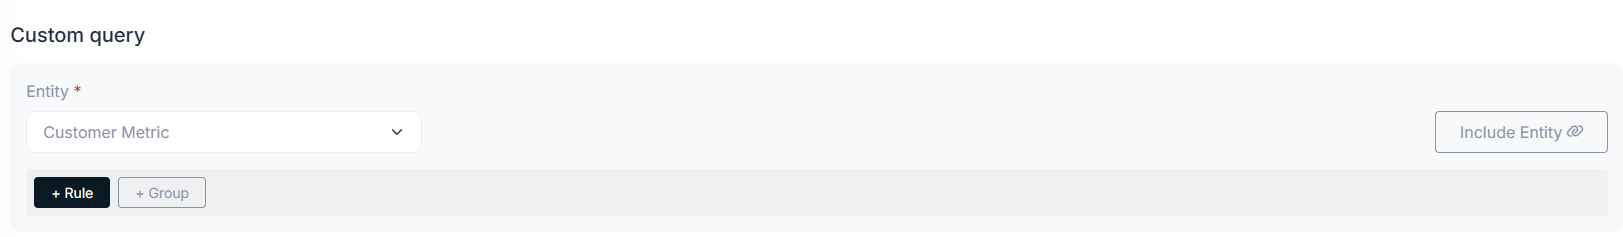
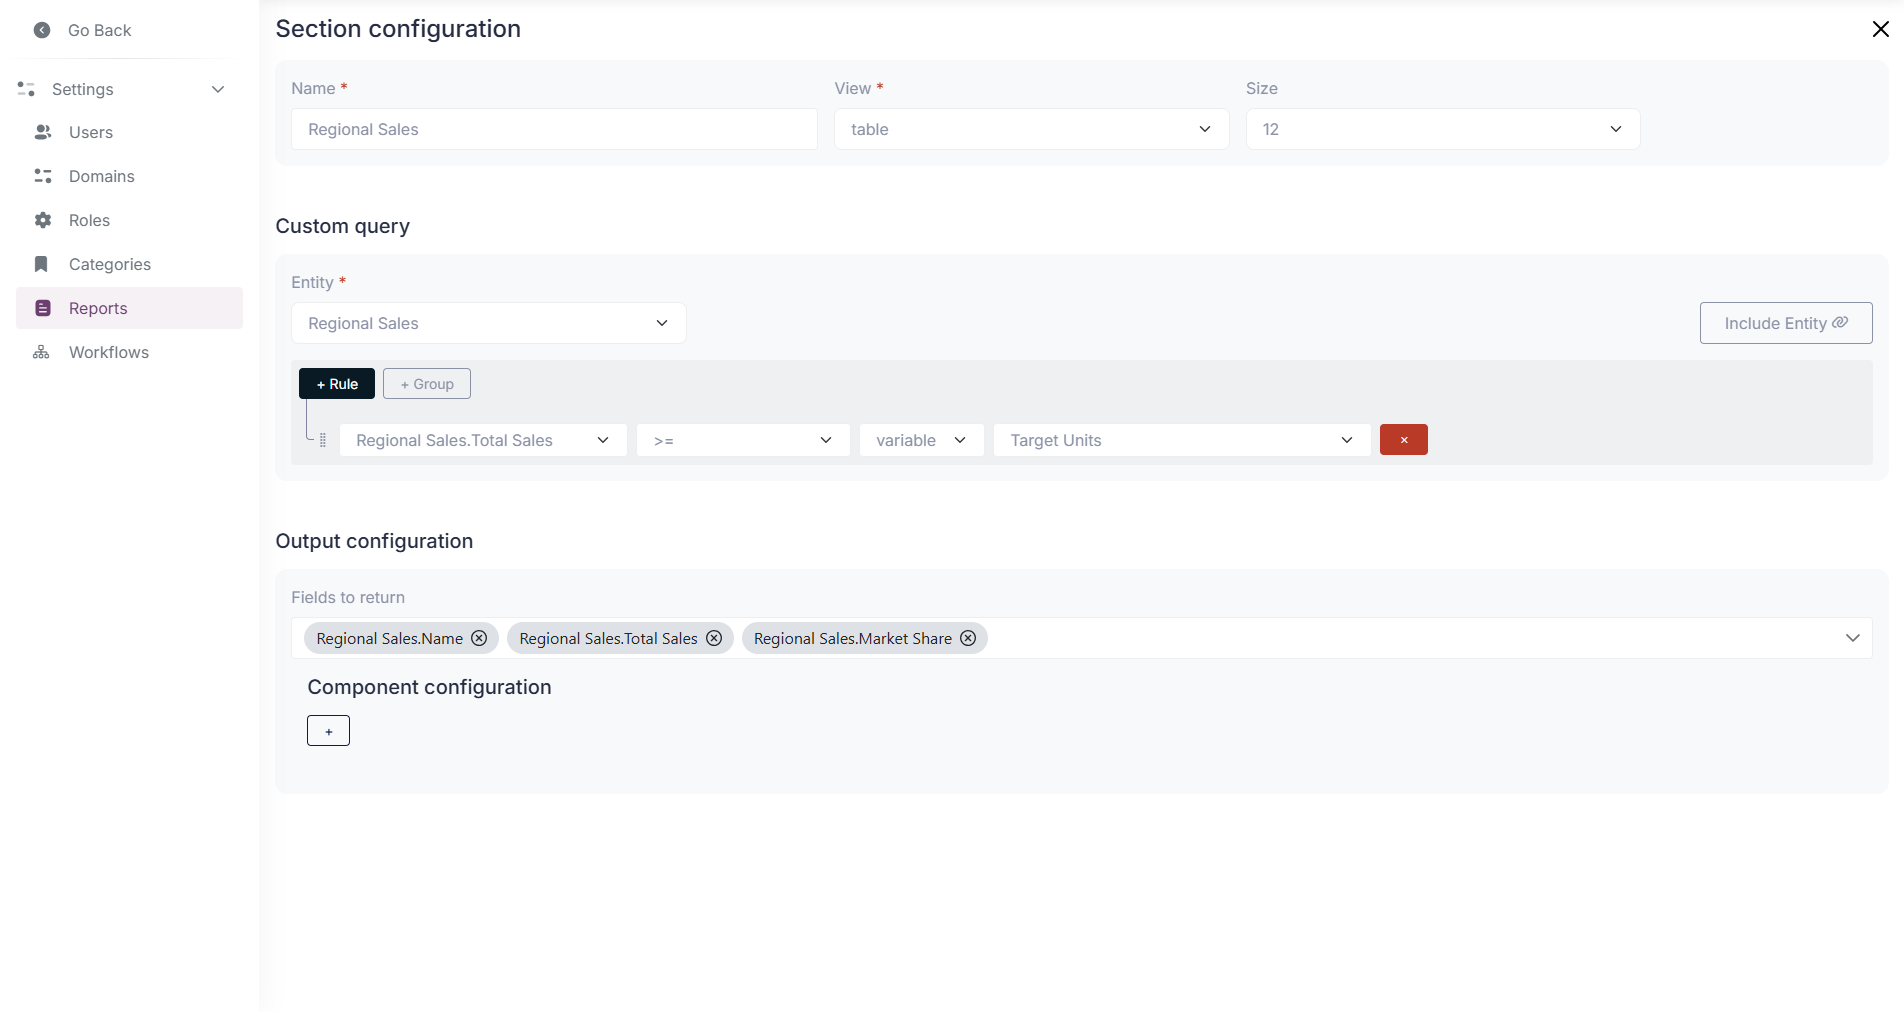
How to use the Report Custom Query Builder?
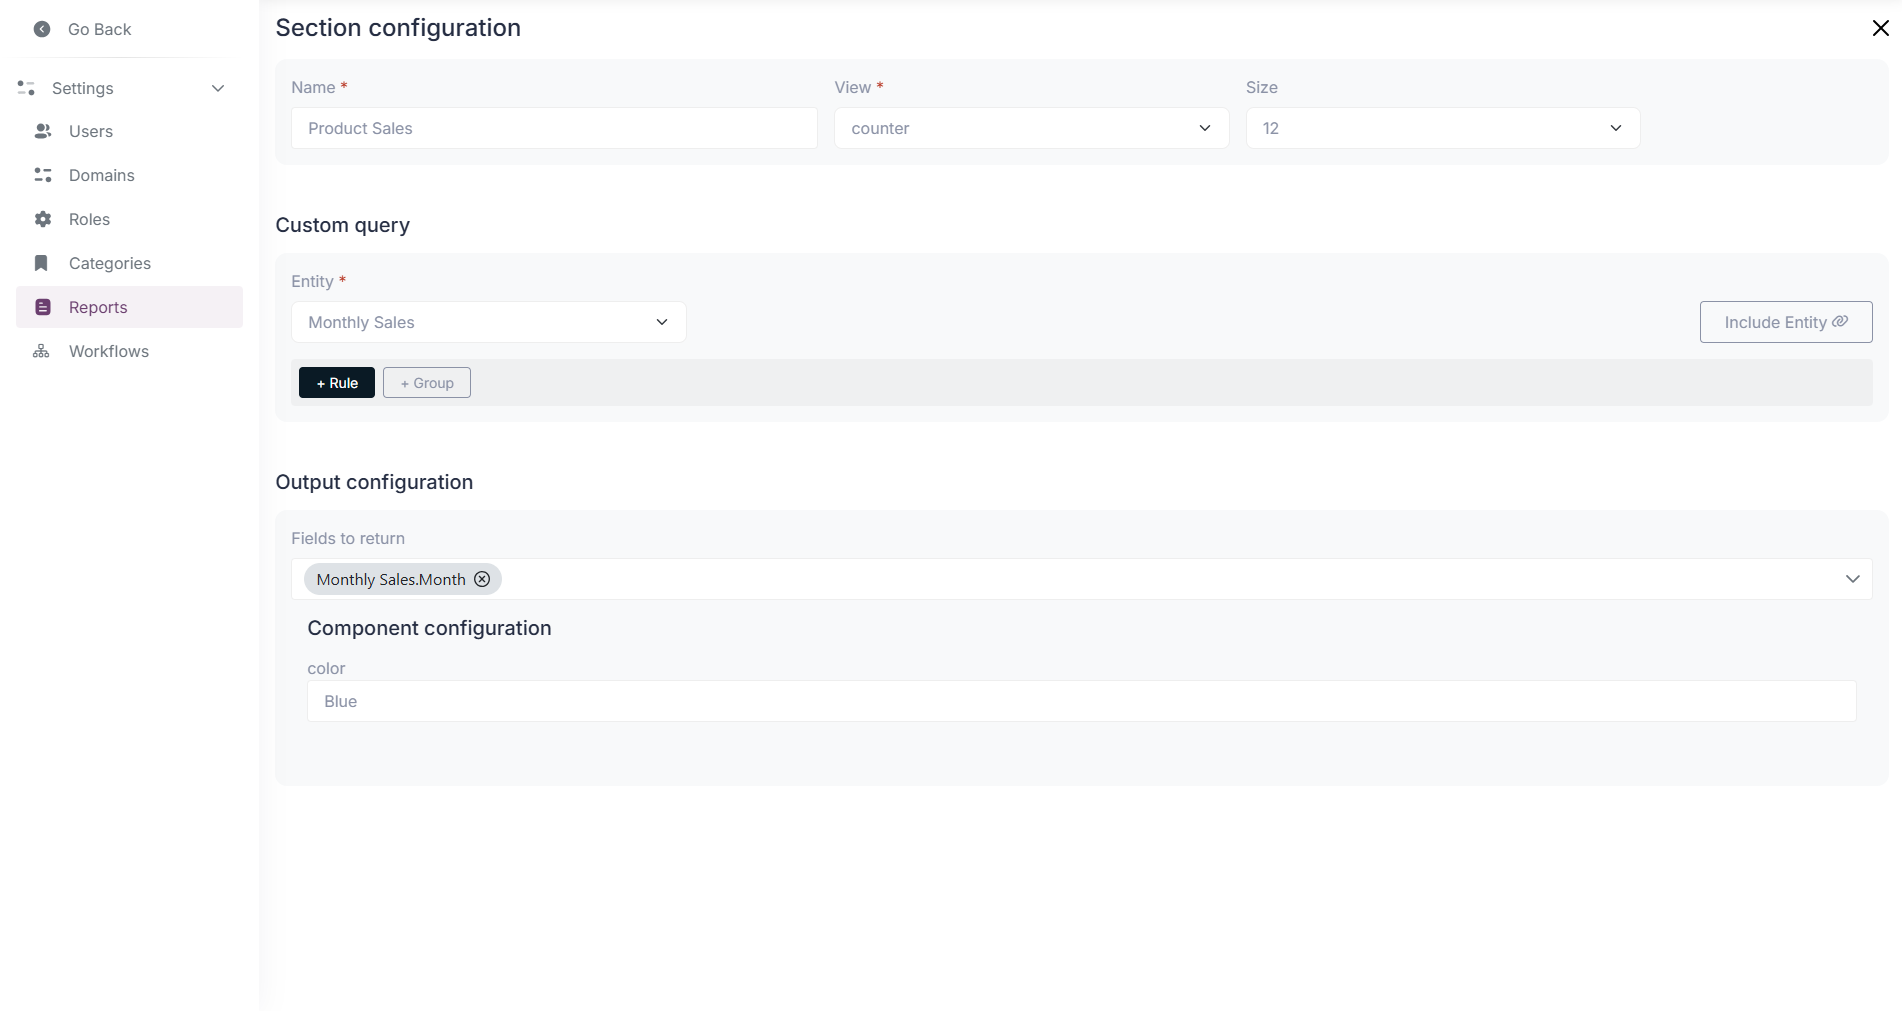
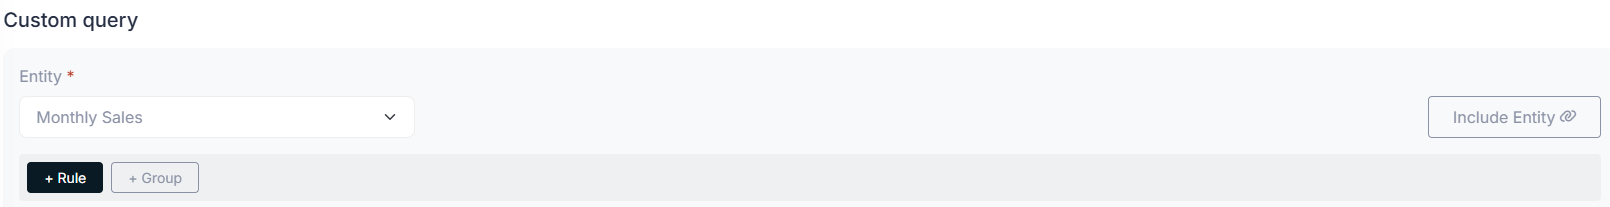
Section titled “How to use the Report Custom Query Builder?”This builder allows you to create complex queries to filter, group, and aggregate data for your reports. To access it, use the configuration button (gear icon) in the top right corner of each section.
In the Custom Query section of the configuration, you can define:
- The main data source
- Optional joins with related entities
- Filter rules and grouped conditions
- The report fields that will be returned by the query
Select a main data source
Section titled “Select a main data source”Select a main data source for the query. It must be an entity available in the application.
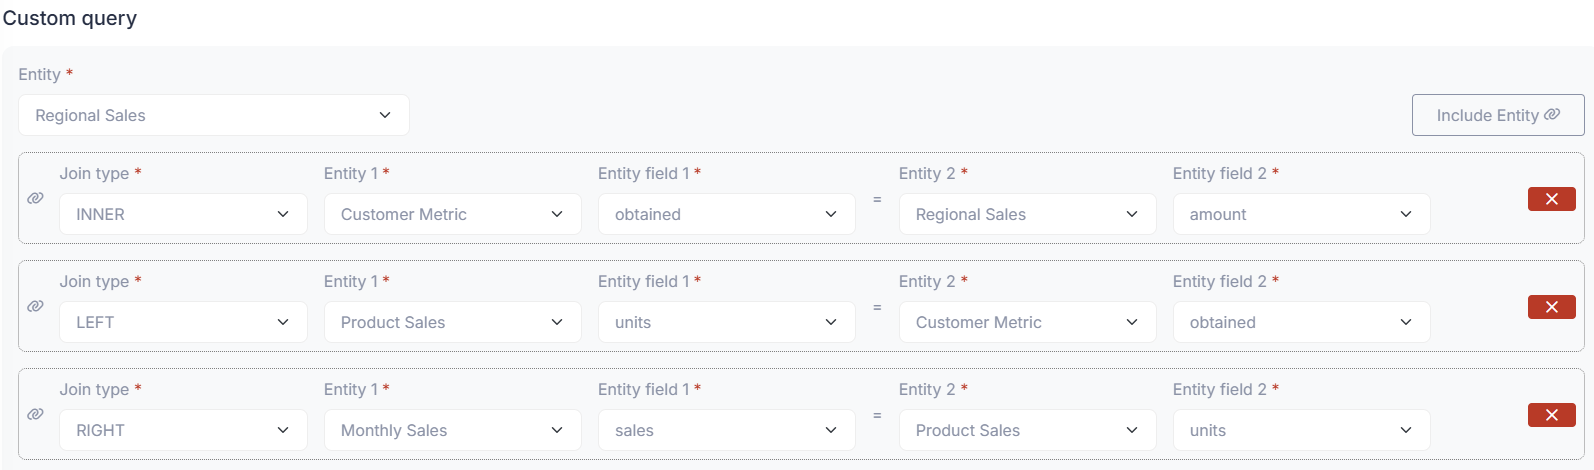
- Using multiple data sources is supported through the Include entity option, which allows you to join related entities to the main data source.
- The Include entity option creates a basic join structure from the available dropdowns. Please fill them according to your needs:
- Type of join: Inner, Left, Right
- First entity: main entity selected for the query
- First field: field from the main entity to be used in the join
- Second entity: related entity to be joined by the query
- Second field: field from the related entity to be used in the join
Example of a join between two entities:
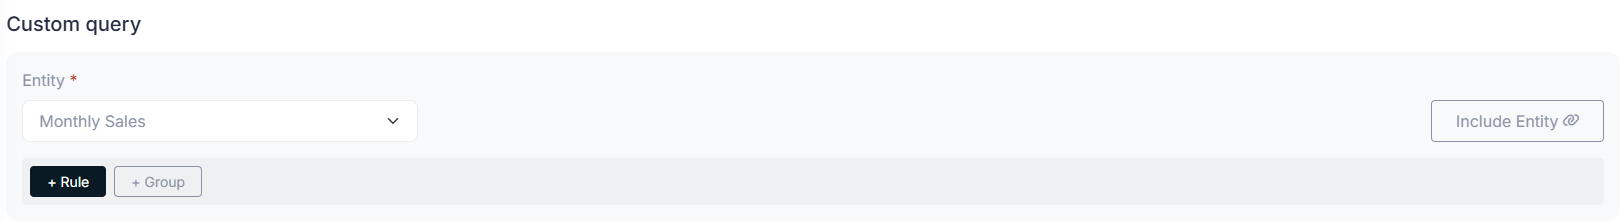
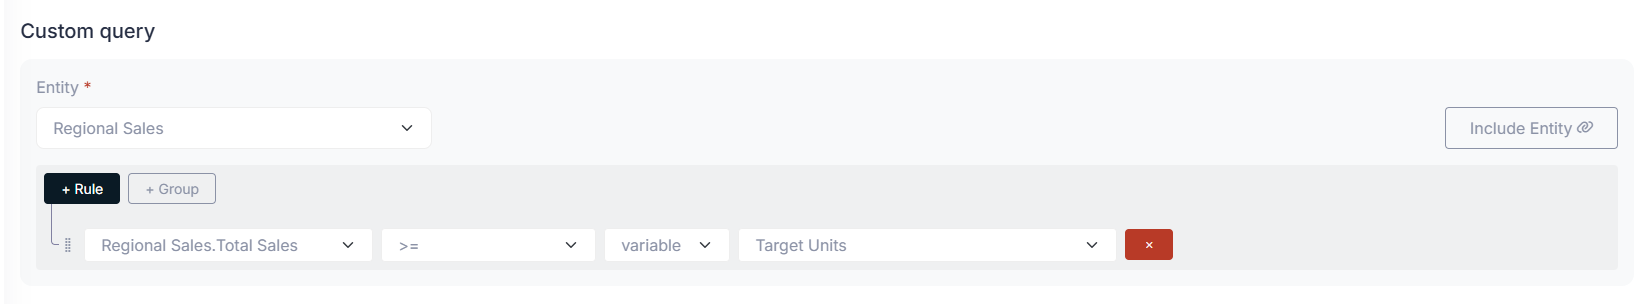
Add rules
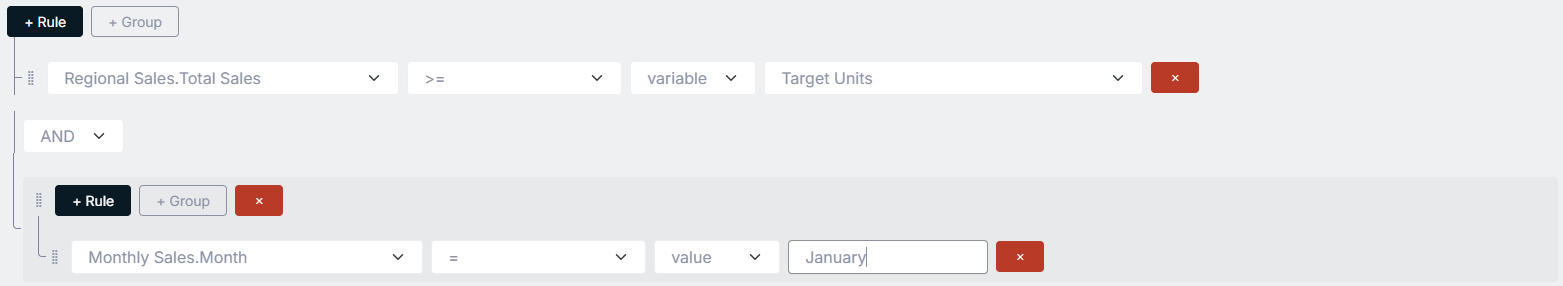
Section titled “Add rules”Add rules to filter the data by clicking on the + Rule button and selecting the desired criteria.
- You can use variables created earlier in the rules for the section display.
- Grouping of rules is supported through the + Group button, which allows you to create nested conditions using
AND/OR.
Example of a rule using a variable:

Example of a group of rules:
- Add rules to filter the data by clicking on the ”+ Rule” button and selecting the desired criteria.
- You can use variables created before in the rules for the section display.
- Example of a rule using a variable:
- Grouping of rules is supported by using the ”+ Group” button, which allows you to create nested conditions for the query using AND/OR operators.
- Example of a group of rules:
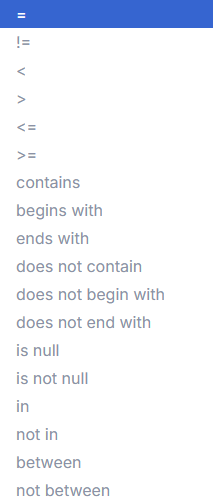
There are some available operators for the rules, as seen in the following image: - The default operator is “equals”, but you can change it by clicking on the operator dropdown.
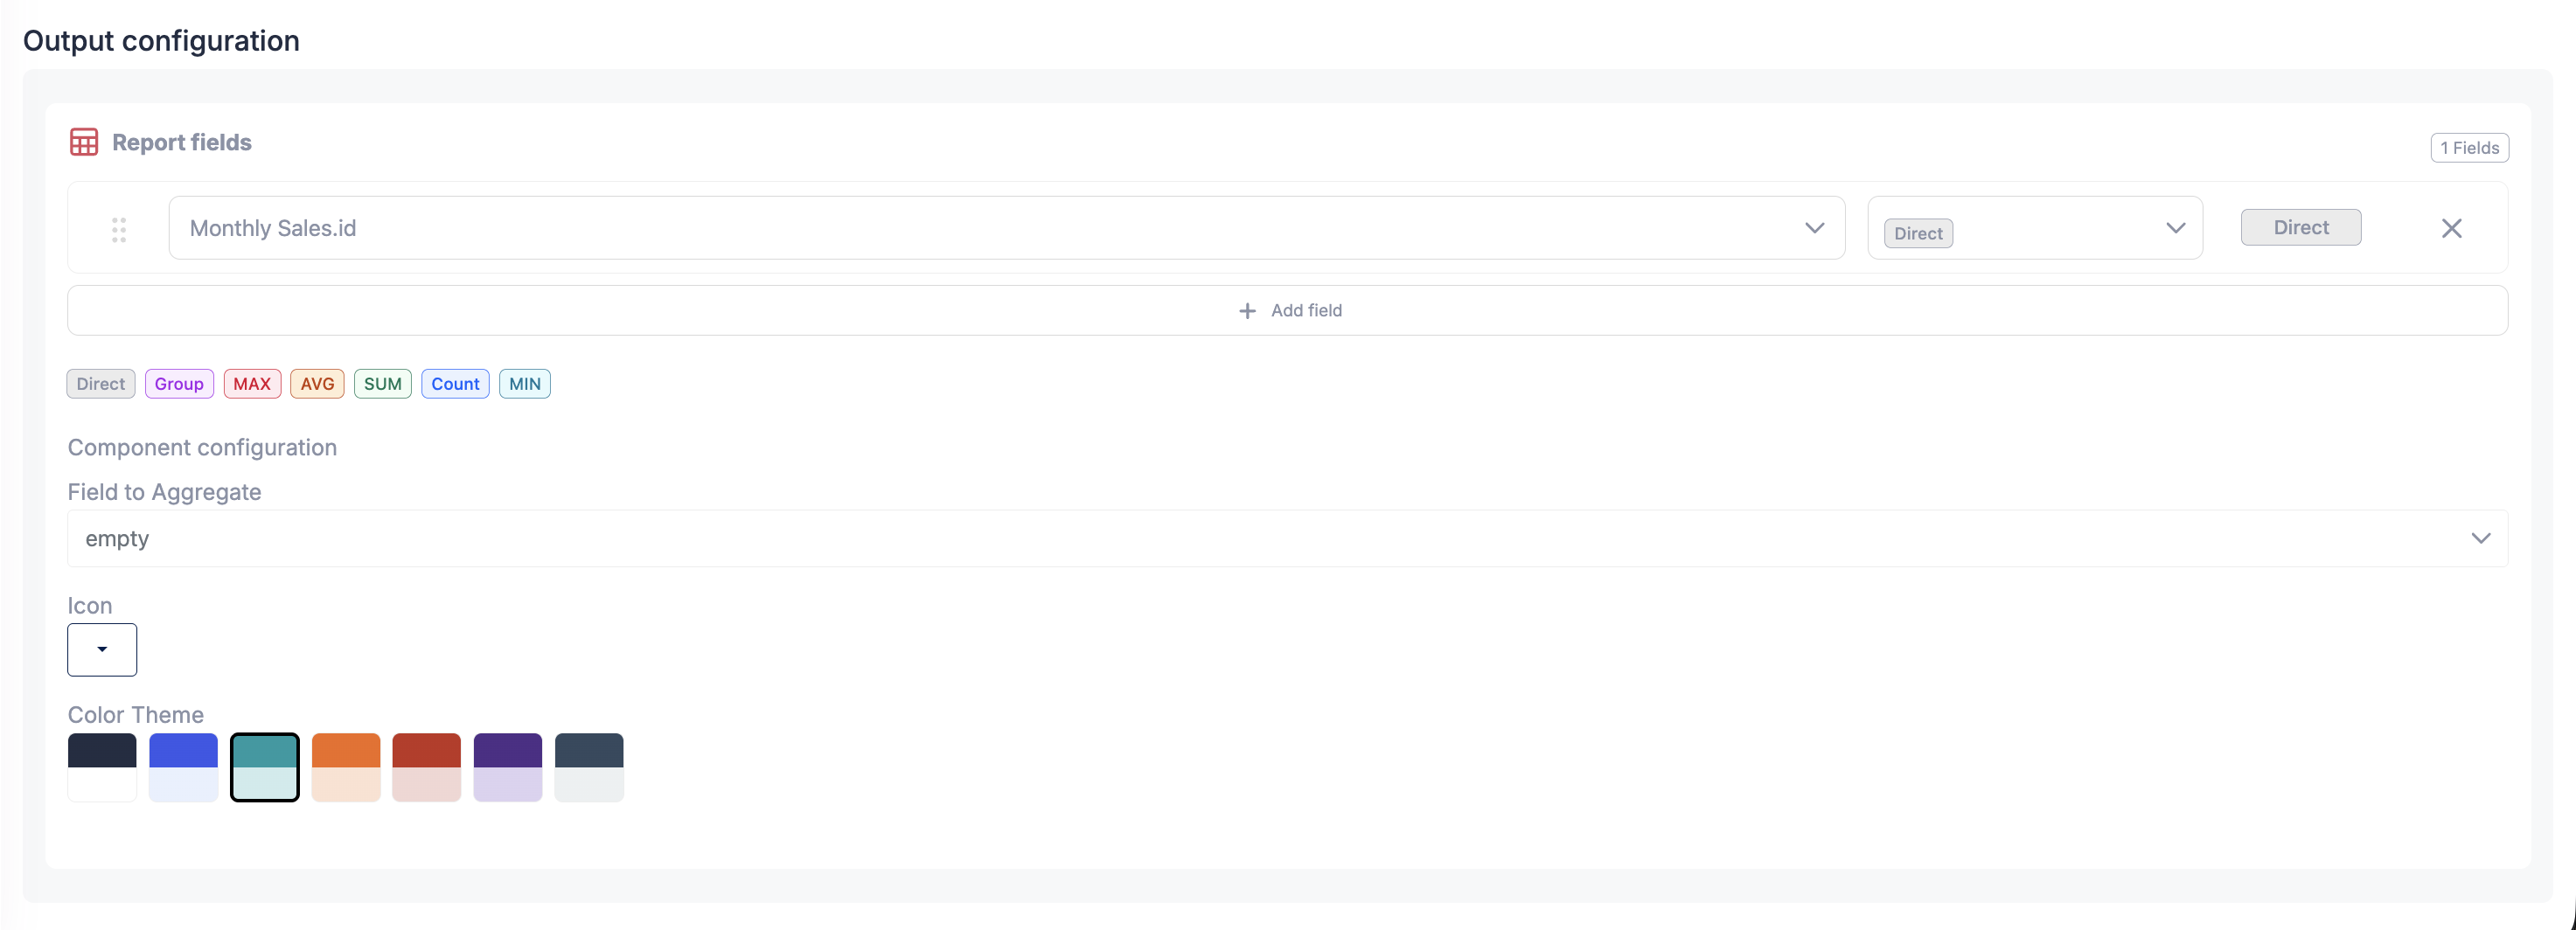
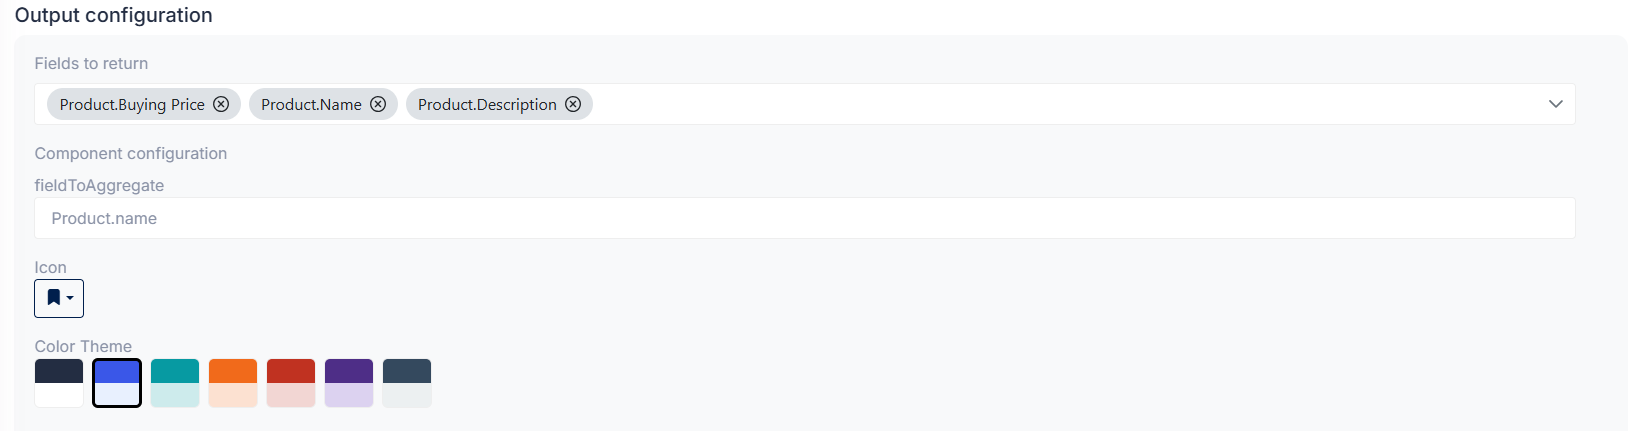
Configure report fields
Section titled “Configure report fields”The Report fields area defines the columns or values returned by the query.
Each row in this section represents one returned field and includes:
- A drag handle to reorder the field
- A field dropdown to select the field
- An operation dropdown to define how the selected field will be returned
- A remove button to delete the row
Use the Add field button to add more returned fields.
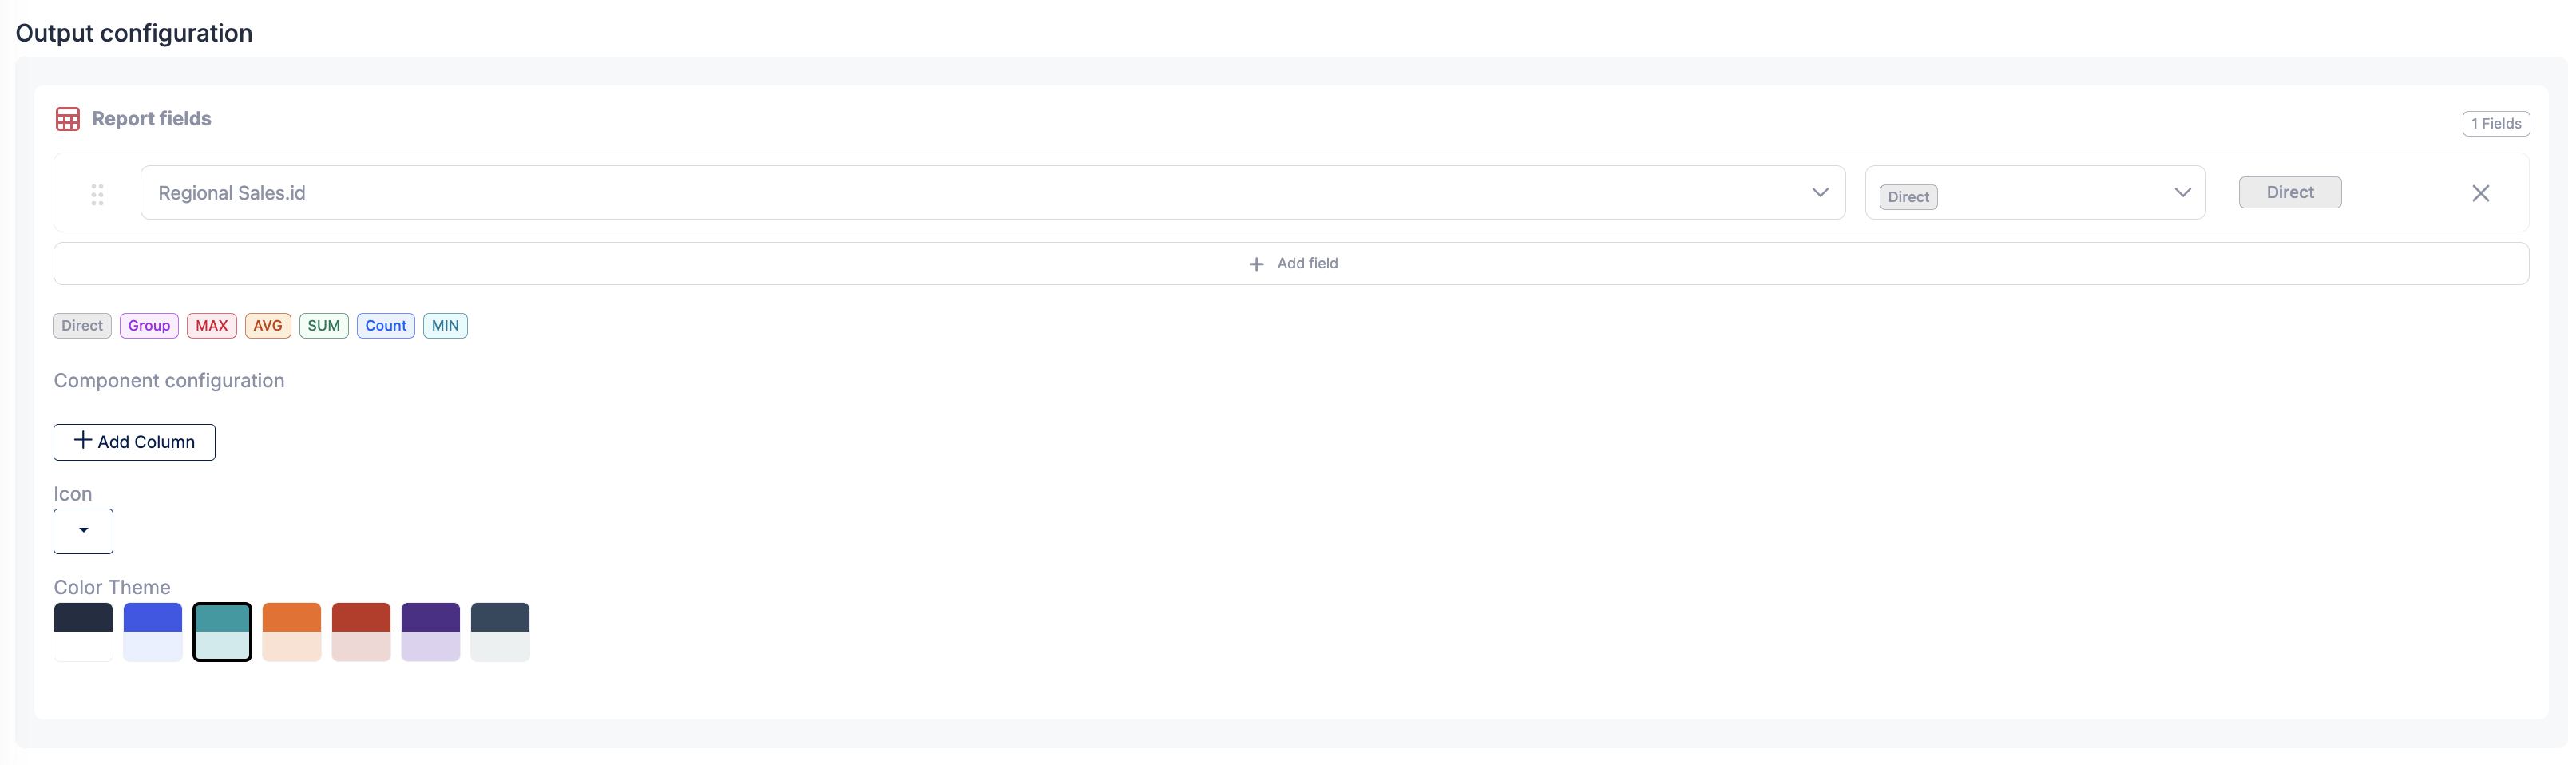
The available operations are:
Direct: returns the selected field without aggregationGroup: groups the result set by the selected fieldCount: counts matching rows or valuesSUM: sums the selected numeric fieldAVG: returns the average of the selected numeric fieldMIN: returns the minimum value of the selected fieldMAX: returns the maximum value of the selected field
The builder also includes validation and helper behaviors to make query configuration easier.
- If a field is added with the
Groupoperation and there is no matchingDirectfield for it, the system will automatically try to add aDirectfield for that grouped field. - If the query contains
Directfields together with aggregation operations such asAVG,Count,SUM,MIN, orMAX, the system will show the following warning:
Warning: You have direct fields with aggregations. Consider grouping the direct fields or removing the aggregations.
This warning helps prevent inconsistent query results when aggregated values are mixed with non-grouped direct fields.
Reorder report fields
Section titled “Reorder report fields”The report fields list supports drag and drop.
You can drag rows to change the order of the returned fields in the query result. This is especially useful for table sections, where the order of the rows in Report fields determines the order of the columns displayed in the table.
Examples
Section titled “Examples”- Use
Directwhen you want to return the raw value of a field. - Use
Groupon a category or status field to group results by that field. - Use
Counttogether withGroupto count records per category. - Use
SUMtogether withGroupto total an amount field by category. - Use
AVG,MIN, orMAXwhen you want summarized numeric results. - If you group by a field and do not add the same field as
Direct, the system may automatically add theDirectfield for you. - If you keep
Directfields together with aggregation operations, the system will display a warning suggesting that you group the direct fields or remove the aggregations.
How to view a Report in the module?
Section titled “How to view a Report in the module?”To view a report, go to the Reports module and click on the “View” button next to the desired report.
-
Using the filter input at the top can help you find the report you are looking for.
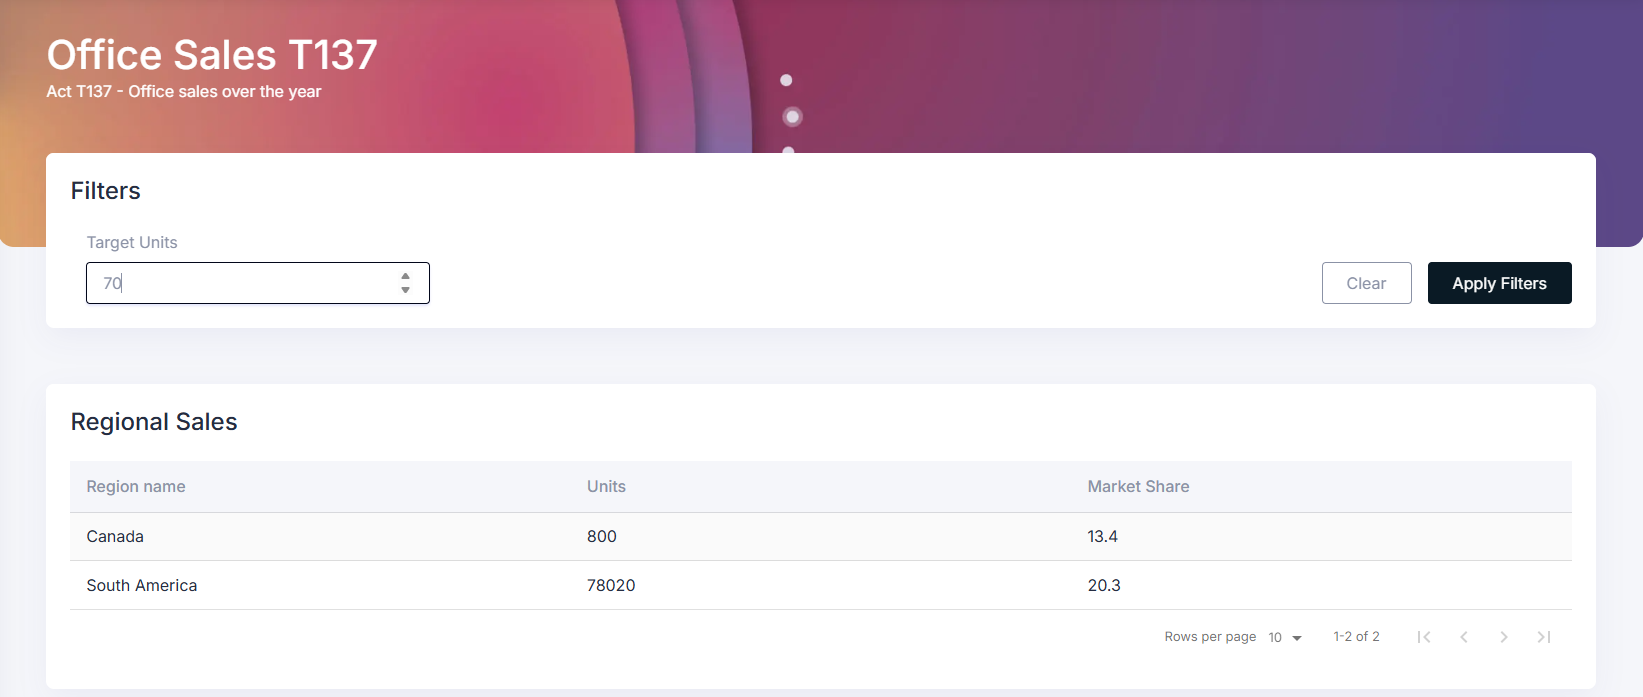
This will open the report in a new page, where you can see the data visualizations and summaries based on the configured sections.
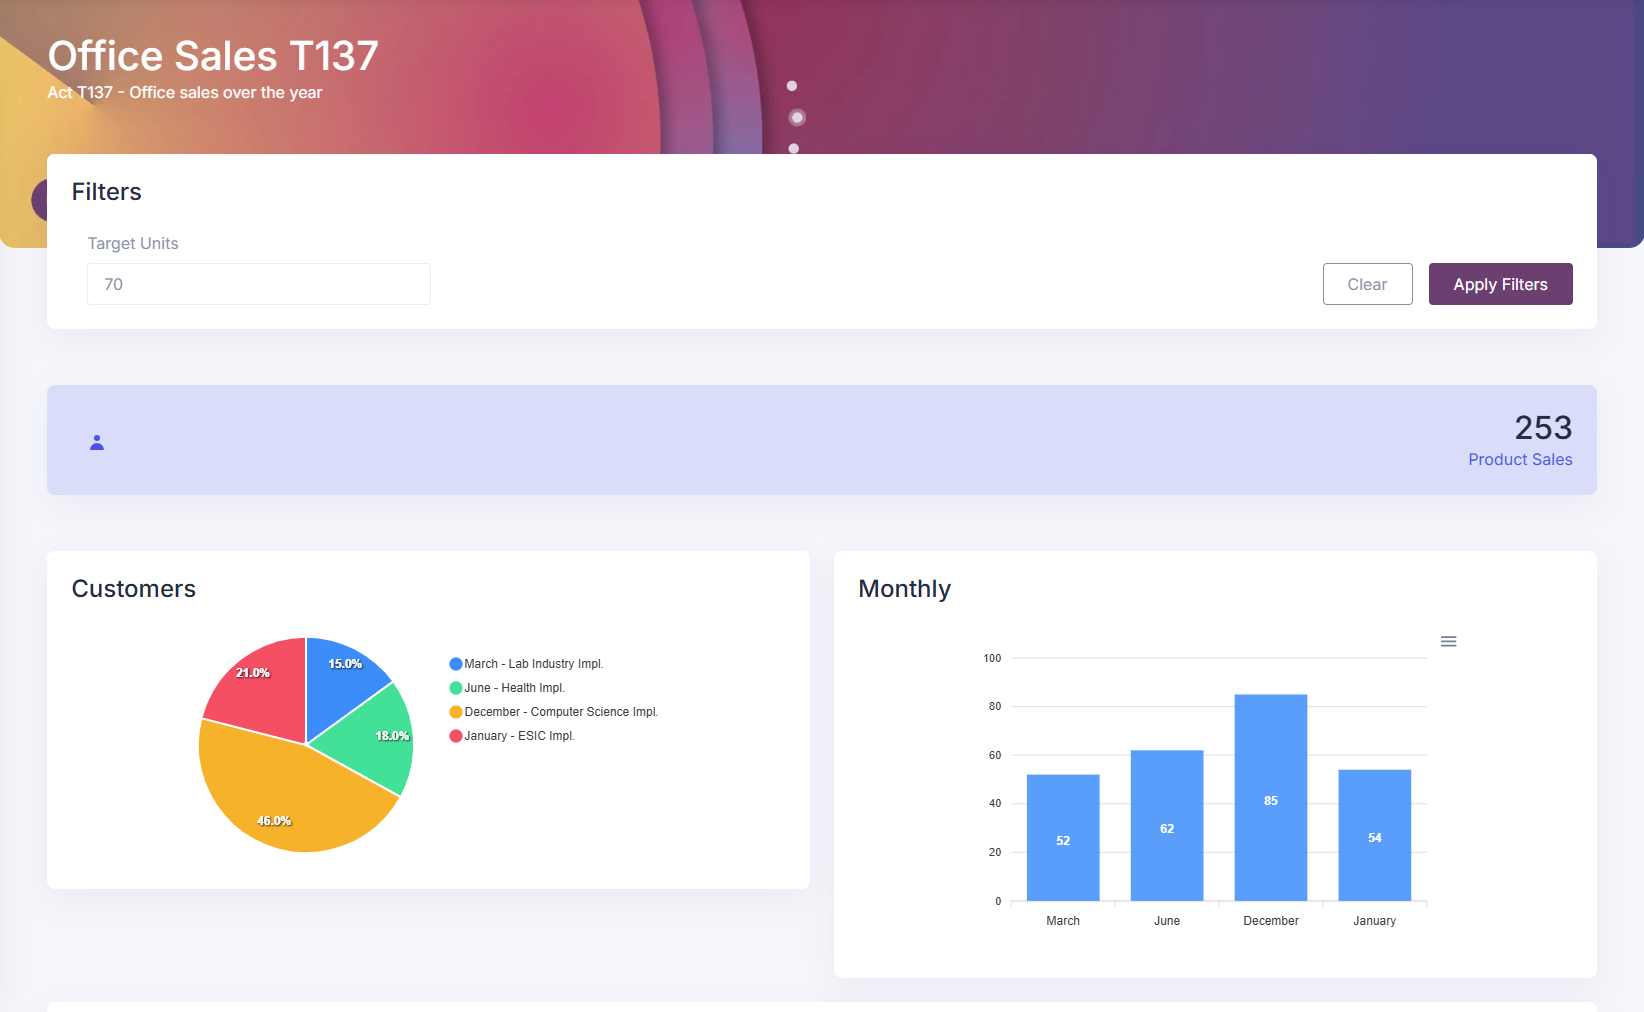
-
By using the filter variables created earlier, you can refine the data displayed in the report.
How to assign a report to a role?
Section titled “How to assign a report to a role?”To assign a report to a role, go to the Roles module in the settings panel. Select the desired role from the top dropdown menu, the role to which you want to assign the report.
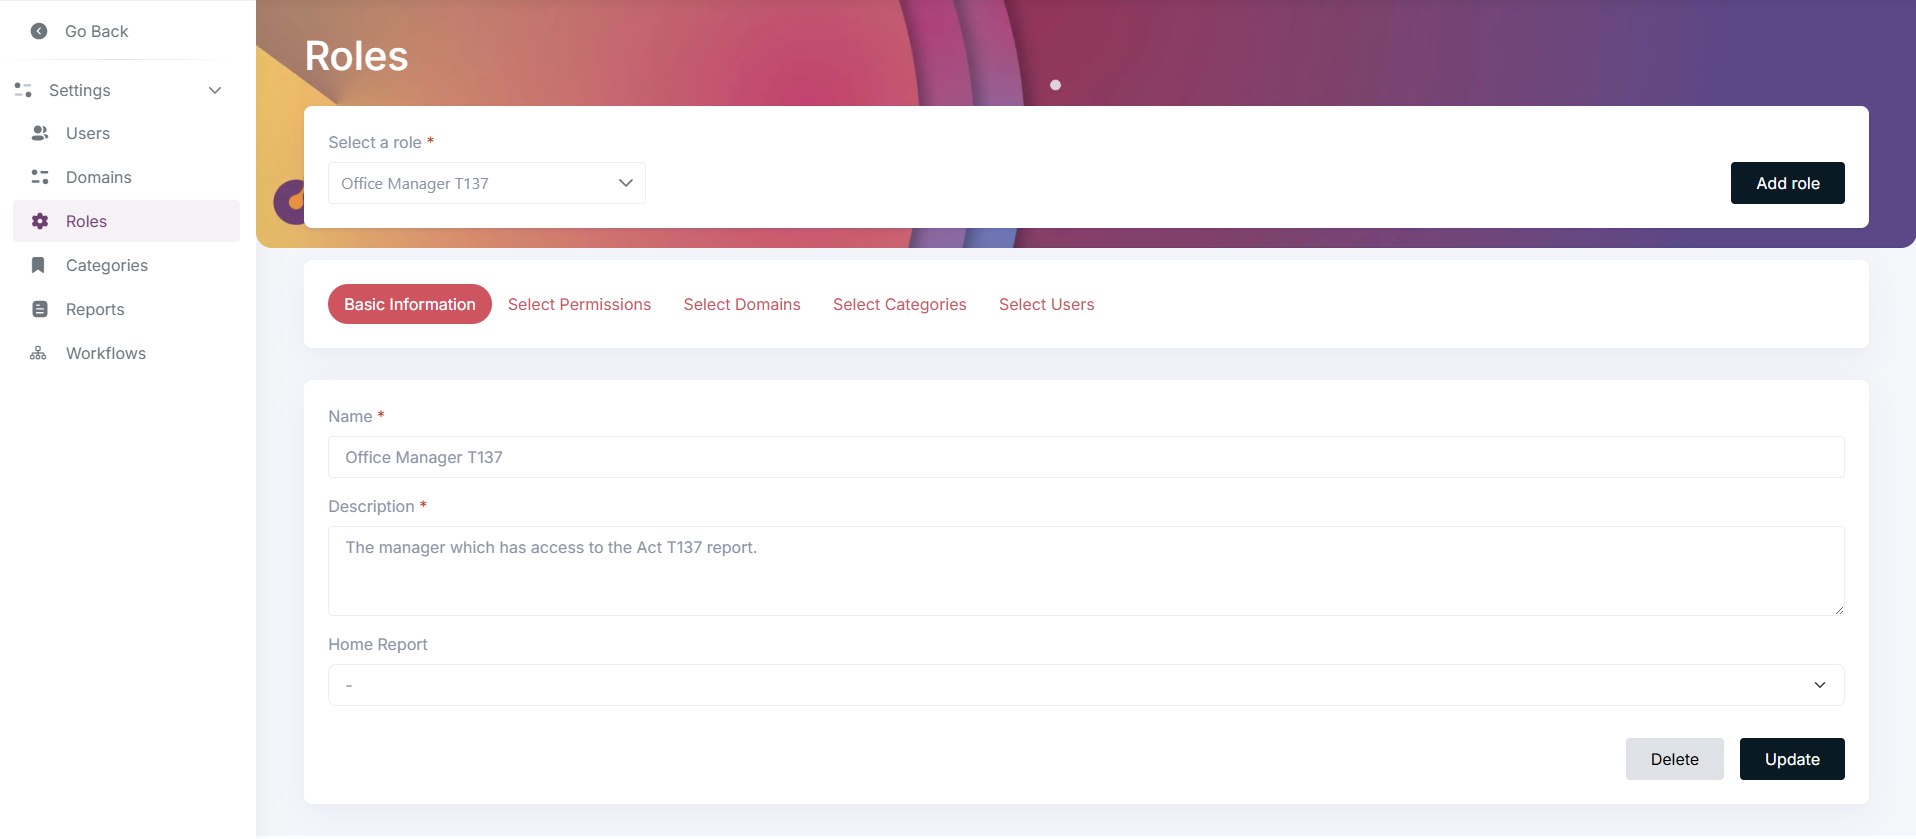
Next, set the “Home Report” field with the desired report to be assigned to the role.
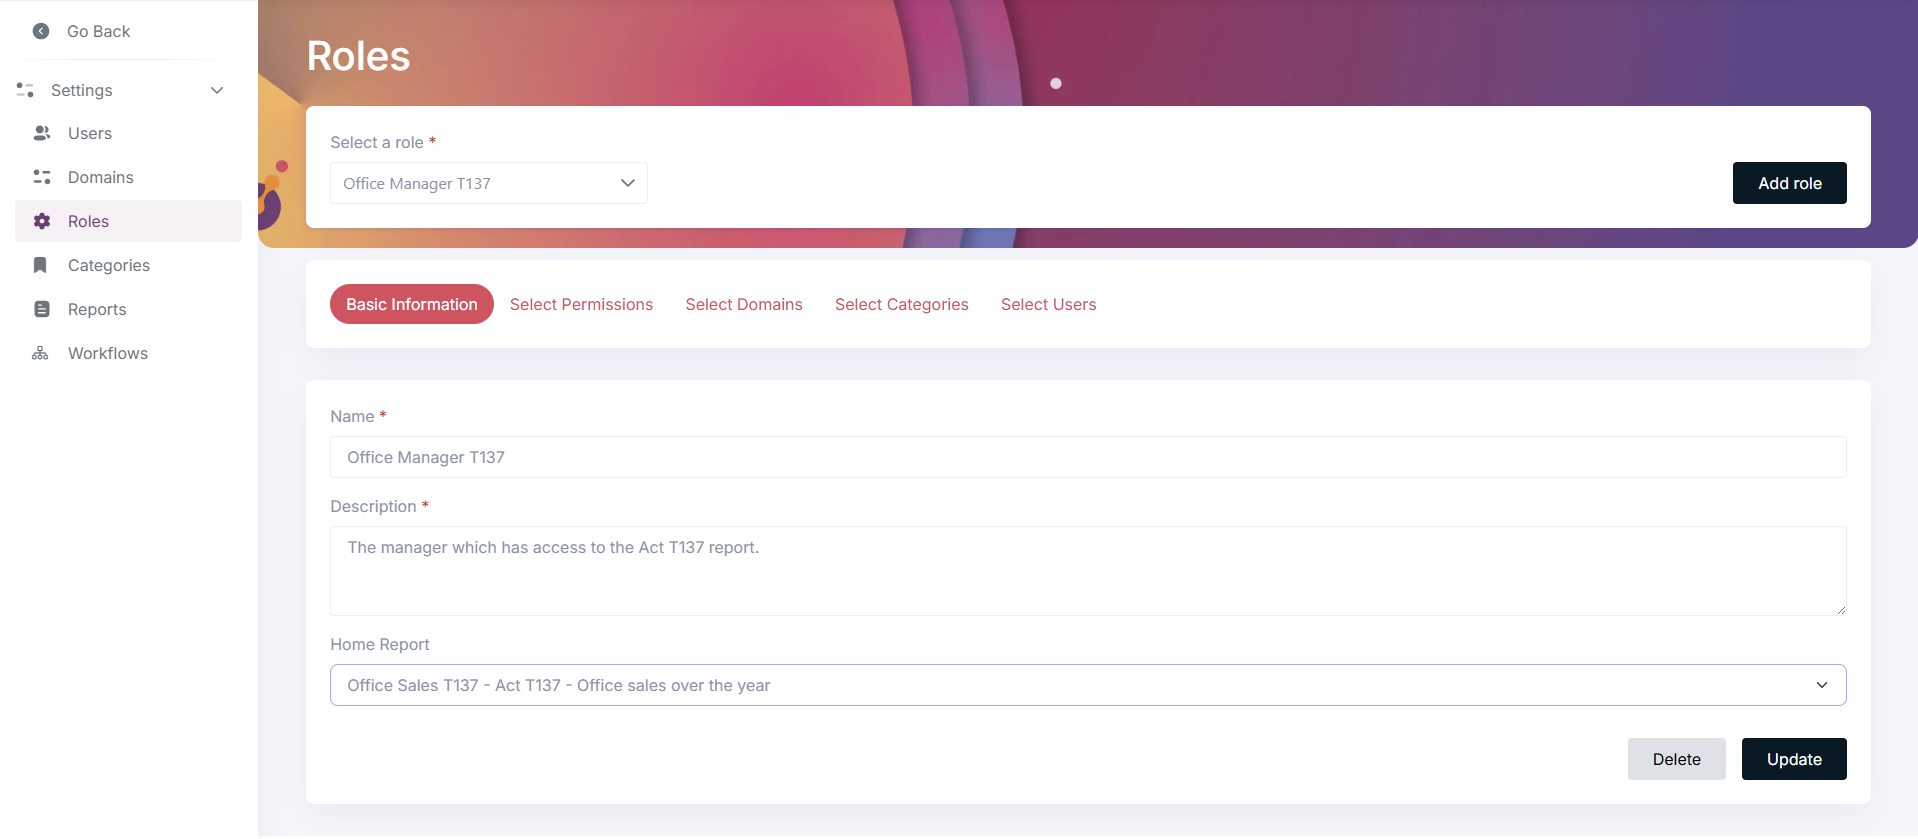
Click on the “Update” button located at the bottom right of the page to save the changes. The role will now have the selected report assigned as the home report, which will be displayed on the dashboard when a user with that role logs in.
Tips and common mistakes
Section titled “Tips and common mistakes”- Use the filter input at the top of the Reports module to quickly find the report you are looking for.
- Remember to save the report after making changes by clicking on the “Save” button located at the bottom right of the page.
- When using the “Include entity” option in the Custom Query Builder, ensure that the join fields are correctly selected to avoid incorrect data retrieval.
- In the Report fields section, each row has its own field selector and operation selector. Be sure both are configured correctly.
- Use
Directwhen you want the raw field value without grouping or aggregation. - Use
Groupwhen you want to group the result set by a field. - Use aggregation operations such as
Count,SUM,AVG,MIN, orMAXwhen you want summarized values. - If you add a field with the
Groupoperation, the system may automatically add the same field asDirectwhen needed. - If you see the warning
Warning: You have direct fields with aggregations. Consider grouping the direct fields or removing the aggregations., review your report fields configuration carefully. - When using aggregation operations, make sure any non-aggregated fields are grouped appropriately.
- You can drag and drop report field rows to reorder the query output. In table sections, this also changes the display order of the columns.
- Be careful when combining grouped and non-grouped fields, as the results may differ from what you expect.
- The default operator for rules is equals, but you can change it by clicking on the operator dropdown.
- When creating variables for report filters, use descriptive names to easily identify their purpose. Numeric label values are also supported.
- Experiment with different section types and configurations to find the best way to visualize your data. Each section type (Table, Pie Chart, Bar Chart, Counter) has its own strengths and use cases.
My report is not showing sections within it, what can I do?
Section titled “My report is not showing sections within it, what can I do?”- Ensure that you have added sections to the report and configured them correctly.
- Ensure that the data source entities selected for each section have data available.
- Change your filter criteria to be less restrictive, or remove them temporarily to verify that data is being fetched.
- If you are using the Custom Query Builder, double-check your query logic, joins, rules, selected report fields, and field operations to ensure they are correctly configured.
- If a warning appears about direct fields with aggregations, review the report fields and make sure direct fields are grouped correctly or that unnecessary aggregations are removed.
- If you are using aggregation functions, verify that the selected fields and
Groupoperations match the kind of result expected by the section.